RBS 2010 Annual Report Download - page 345
Download and view the complete annual report
Please find page 345 of the 2010 RBS annual report below. You can navigate through the pages in the report by either clicking on the pages listed below, or by using the keyword search tool below to find specific information within the annual report.-
 1
1 -
2
-
3
-
4
-
5
-
6
-
7
-
8
-
9
-
10
-
11
-
12
-
13
-
14
-
15
-
16
-
17
-
18
-
19
-
20
-
21
-
22
-
23
-
24
-
25
-
26
-
27
-
28
-
29
-
30
-
31
-
32
-
33
-
34
-
35
-
36
-
37
-
38
-
39
-
40
-
41
-
42
-
43
-
44
-
45
-
46
-
47
-
48
-
49
-
50
-
51
-
52
-
53
-
54
-
55
-
56
-
57
-
58
-
59
-
60
-
61
-
62
-
63
-
64
-
65
-
66
-
67
-
68
-
69
-
70
-
71
-
72
-
73
-
74
-
75
-
76
-
77
-
78
-
79
-
80
-
81
-
82
-
83
-
84
-
85
-
86
-
87
-
88
-
89
-
90
-
91
-
92
-
93
-
94
-
95
-
96
-
97
-
98
-
99
-
100
-
101
-
102
-
103
-
104
-
105
-
106
-
107
-
108
-
109
-
110
-
111
-
112
-
113
-
114
-
115
-
116
-
117
-
118
-
119
-
120
-
121
-
122
-
123
-
124
-
125
-
126
-
127
-
128
-
129
-
130
-
131
-
132
-
133
-
134
-
135
-
136
-
137
-
138
-
139
-
140
-
141
-
142
-
143
-
144
-
145
-
146
-
147
-
148
-
149
-
150
-
151
-
152
-
153
-
154
-
155
-
156
-
157
-
158
-
159
-
160
-
161
-
162
-
163
-
164
-
165
-
166
-
167
-
168
-
169
-
170
-
171
-
172
-
173
-
174
-
175
-
176
-
177
-
178
-
179
-
180
-
181
-
182
-
183
-
184
-
185
-
186
-
187
-
188
-
189
-
190
-
191
-
192
-
193
-
194
-
195
-
196
-
197
-
198
-
199
-
200
-
201
-
202
-
203
-
204
-
205
-
206
-
207
-
208
-
209
-
210
-
211
-
212
-
213
-
214
-
215
-
216
-
217
-
218
-
219
-
220
-
221
-
222
-
223
-
224
-
225
-
226
-
227
-
228
-
229
-
230
-
231
-
232
-
233
-
234
-
235
-
236
-
237
-
238
-
239
-
240
-
241
-
242
-
243
-
244
-
245
-
246
-
247
-
248
-
249
-
250
-
251
-
252
-
253
-
254
-
255
-
256
-
257
-
258
-
259
-
260
-
261
-
262
-
263
-
264
-
265
-
266
-
267
-
268
-
269
-
270
-
271
-
272
-
273
-
274
-
275
-
276
-
277
-
278
-
279
-
280
-
281
-
282
-
283
-
284
-
285
-
286
-
287
-
288
-
289
-
290
-
291
-
292
-
293
-
294
-
295
-
296
-
297
-
298
-
299
-
300
-
301
-
302
-
303
-
304
-
305
-
306
-
307
-
308
-
309
-
310
-
311
-
312
-
313
-
314
-
315
-
316
-
317
-
318
-
319
-
320
-
321
-
322
-
323
-
324
-
325
-
326
-
327
-
328
-
329
-
330
-
331
-
332
-
333
-
334
-
 335
335 -
 336
336 -
 337
337 -
 338
338 -
 339
339 -
 340
340 -
 341
341 -
 342
342 -
 343
343 -
 344
344 -
 345
345 -
 346
346 -
 347
347 -
 348
348 -
 349
349 -
 350
350 -
 351
351 -
 352
352 -
 353
353 -
 354
354 -
 355
355 -
356
-
357
-
358
-
359
-
360
-
361
-
362
-
363
-
364
-
365
-
366
-
367
-
368
-
369
-
370
-
371
-
372
-
373
-
374
-
375
-
376
-
377
-
378
-
379
-
380
-
381
-
382
-
383
-
384
-
385
-
386
-
387
-
388
-
389
-
390
-
391
-
392
-
393
-
394
-
395
-
396
-
397
-
398
-
399
-
400
-
401
-
402
-
403
-
404
-
405
-
406
-
407
-
408
-
409
-
410
-
411
-
412
-
413
-
414
-
415
-
416
-
417
-
418
-
419
-
420
-
421
-
422
-
423
-
424
-
425
-
426
-
427
-
428
-
429
-
430
-
431
-
432
-
433
-
434
-
435
-
436
-
437
-
438
-
439
-
440
-
441
-
442
-
443
-
444
-
445
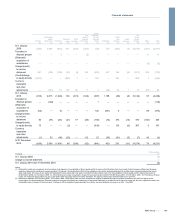
 |
 |

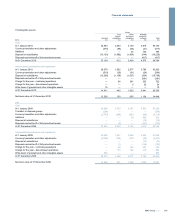
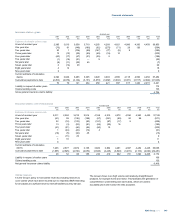
Group
Pension
Accelerated
capital
allowances Provisions
Deferred
gains
IFRS
transition
Fair
value of
financial
instruments
Available-
for-sale
financial
assets Intangibles
Cash
flow
hedging
Share
schemes
Tax
losses
carried
forward Other Total
£m £m £m £m £m £m £m £m £m £m £m £m £m
At 1 January
2009 (382) 3,084 (814) 611 (420) (353) (35) 774 (483) (3) (4,730) (166) (2,917)
Transfers to
disposal groups — — 2 — — (2) — — — — — 11 11
(Disposal)/
acquisition of
subsidiaries — — — — — — — — — — — (8) (8)
Charge/(credit)
to income
statement 691 (165) (740) (81) (6) 164 (483) 397 165 (6) (973) 305 (732)
(Credit)/charge
to equity directly (1,033) — — (501) 1 — 126 — 204 — 554 1 (648)
Currency
translation
and other
adjustments —(104) 72 107 52 7 1 (63) 54 1 15 (76) 66
At 1 January
2010 (724) 2,815 (1,480) 136 (373) (184) (391) 1,108 (60) (8) (5,134) 67 (4,228)
Transfers to
disposal groups —(120) — — — — 1 — — — — — (119)
(Disposal)/
acquisition of
subsidiaries (32) — (1) — — — 120 (631) 6 — — 65 (473)
Charge/(credit)
to income
statement 46 (91) (24) (21) 77 (20) (160) (12) 273 (12) 470 (102) 424
Charge/(credit)
to equity directly 73 — — (2) — — (434) — 133 (6) 397 6 167
Currency
translation
and other
adjustments (1) 52 (96) (25) — 112 23 (36) (61) (5) (7) 42 (2)
At 31 December
2010 (638) 2,656 (1,601) 88 (296) (92) (841) 429 291 (31) (4,274) 78 (4,231)
IFRS transition
Company £m
At 1 January 2009 (3)
Charge to income statement 1
At 1 January 2010 and 31 December 2010 (2)
Notes:
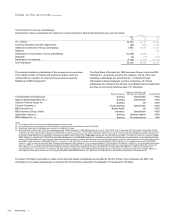
(1) Deferred tax assets are recognised, as set out above, that depend on the availability of future taxable profits in excess of profits arising from the reversal of other temporary differences. Business
projections prepared for impairment reviews (see Note 19) indicate it is probable that sufficient future taxable income will be available against which to offset these recognised deferred tax assets
within eight years. UK losses do not expire and Netherlands losses expire after nine years. In jurisdictions where doubt exists over the availability of future taxable profits, deferred tax assets of
£2,008 million (2009 - £2,163 million; 2008 - £1,748 million) have not been recognised in respect of tax losses carried forward of £9,689 million (2009 - £7,759 million; 2008 - £5,779 million). Of these
losses, £41 million will expire within one year, £136 million within five years and £5,913 million thereafter. The balance of tax losses carried forward has no time limit.
(2) Deferred tax liabilities of £279 million (2009 - £279 million; 2008 - £980 million) have not been recognised in respect of retained earnings of overseas subsidiaries and held-over gains on the
incorporation of overseas branches. Retained earnings of overseas subsidiaries are expected to be reinvested indefinitely or remitted to the UK free from further tax. No tax is expected to arise in the
foreseeable future in respect of held-over gains. Changes to UK tax legislation largely exempts from UK tax, overseas dividends received on or after 1 July 2009.
343RBS Group 2010
Financial statements