RBS 2010 Annual Report Download - page 350
Download and view the complete annual report
Please find page 350 of the 2010 RBS annual report below. You can navigate through the pages in the report by either clicking on the pages listed below, or by using the keyword search tool below to find specific information within the annual report.-
 1
1 -
2
-
3
-
4
-
5
-
6
-
7
-
8
-
9
-
10
-
11
-
12
-
13
-
14
-
15
-
16
-
17
-
18
-
19
-
20
-
21
-
22
-
23
-
24
-
25
-
26
-
27
-
28
-
29
-
30
-
31
-
32
-
33
-
34
-
35
-
36
-
37
-
38
-
39
-
40
-
41
-
42
-
43
-
44
-
45
-
46
-
47
-
48
-
49
-
50
-
51
-
52
-
53
-
54
-
55
-
56
-
57
-
58
-
59
-
60
-
61
-
62
-
63
-
64
-
65
-
66
-
67
-
68
-
69
-
70
-
71
-
72
-
73
-
74
-
75
-
76
-
77
-
78
-
79
-
80
-
81
-
82
-
83
-
84
-
85
-
86
-
87
-
88
-
89
-
90
-
91
-
92
-
93
-
94
-
95
-
96
-
97
-
98
-
99
-
100
-
101
-
102
-
103
-
104
-
105
-
106
-
107
-
108
-
109
-
110
-
111
-
112
-
113
-
114
-
115
-
116
-
117
-
118
-
119
-
120
-
121
-
122
-
123
-
124
-
125
-
126
-
127
-
128
-
129
-
130
-
131
-
132
-
133
-
134
-
135
-
136
-
137
-
138
-
139
-
140
-
141
-
142
-
143
-
144
-
145
-
146
-
147
-
148
-
149
-
150
-
151
-
152
-
153
-
154
-
155
-
156
-
157
-
158
-
159
-
160
-
161
-
162
-
163
-
164
-
165
-
166
-
167
-
168
-
169
-
170
-
171
-
172
-
173
-
174
-
175
-
176
-
177
-
178
-
179
-
180
-
181
-
182
-
183
-
184
-
185
-
186
-
187
-
188
-
189
-
190
-
191
-
192
-
193
-
194
-
195
-
196
-
197
-
198
-
199
-
200
-
201
-
202
-
203
-
204
-
205
-
206
-
207
-
208
-
209
-
210
-
211
-
212
-
213
-
214
-
215
-
216
-
217
-
218
-
219
-
220
-
221
-
222
-
223
-
224
-
225
-
226
-
227
-
228
-
229
-
230
-
231
-
232
-
233
-
234
-
235
-
236
-
237
-
238
-
239
-
240
-
241
-
242
-
243
-
244
-
245
-
246
-
247
-
248
-
249
-
250
-
251
-
252
-
253
-
254
-
255
-
256
-
257
-
258
-
259
-
260
-
261
-
262
-
263
-
264
-
265
-
266
-
267
-
268
-
269
-
270
-
271
-
272
-
273
-
274
-
275
-
276
-
277
-
278
-
279
-
280
-
281
-
282
-
283
-
284
-
285
-
286
-
287
-
288
-
289
-
290
-
291
-
292
-
293
-
294
-
295
-
296
-
297
-
298
-
299
-
300
-
301
-
302
-
303
-
304
-
305
-
306
-
307
-
308
-
309
-
310
-
311
-
312
-
313
-
314
-
315
-
316
-
317
-
318
-
319
-
320
-
321
-
322
-
323
-
324
-
325
-
326
-
327
-
328
-
329
-
330
-
331
-
332
-
333
-
334
-
335
-
336
-
337
-
338
-
339
-
 340
340 -
 341
341 -
 342
342 -
 343
343 -
 344
344 -
 345
345 -
 346
346 -
 347
347 -
 348
348 -
 349
349 -
 350
350 -
 351
351 -
 352
352 -
 353
353 -
 354
354 -
 355
355 -
 356
356 -
 357
357 -
 358
358 -
 359
359 -
 360
360 -
361
-
362
-
363
-
364
-
365
-
366
-
367
-
368
-
369
-
370
-
371
-
372
-
373
-
374
-
375
-
376
-
377
-
378
-
379
-
380
-
381
-
382
-
383
-
384
-
385
-
386
-
387
-
388
-
389
-
390
-
391
-
392
-
393
-
394
-
395
-
396
-
397
-
398
-
399
-
400
-
401
-
402
-
403
-
404
-
405
-
406
-
407
-
408
-
409
-
410
-
411
-
412
-
413
-
414
-
415
-
416
-
417
-
418
-
419
-
420
-
421
-
422
-
423
-
424
-
425
-
426
-
427
-
428
-
429
-
430
-
431
-
432
-
433
-
434
-
435
-
436
-
437
-
438
-
439
-
440
-
441
-
442
-
443
-
444
-
445
 |
 |

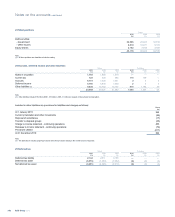
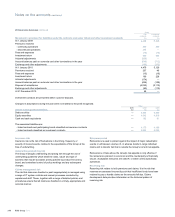
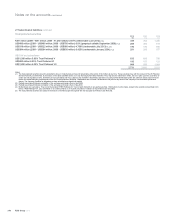
26 Insurance business continued
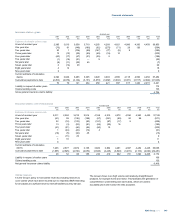
Loss ratios
The following table shows loss ratios for each major class of business, gross and net of reinsurance.
2010 2009 2008
Earned
premiums
Claims
incurred
Loss
ratio
Earned
premiums
Loss
ratio
Earned
premiums
Loss
ratio
£m £m % £m % £m %
Residential property Gross 1,168 643 55 1,129 53 1,103 48
Net 1,107 643 58 1,065 56 1,034 51
Personal motor Gross 2,829 3,530 125 2,984 103 3,173 84
Net
2,760 3,458 125 2,901 103 3,075 83
Commercial property Gross 187 106 57 182 41 194 41
Net
169 106 63 166 45 174 46
Commercial motor Gross 120 128 107 136 100 143 91
Net
119 124 104 135 98 141 91
Other Gross
837 374 45 848 51 994 42
Net
834 369 44 845 51 828 51
Total Gross
5,141 4,781 93 5,279 82 5,607 68
Net 4,989 4,700 94 5,112 83 5,252 71
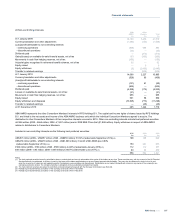
Frequency and severity of specific risks and sources of uncertainty
Most general insurance contracts are written on an annual basis, which
means that the Group’s liability extends for a 12 month period, after
which the Group is entitled to decline or renew or can impose renewal
terms by amending the premium, terms and conditions, or both.
The frequency and severity of claims and the sources of uncertainty for
the key classes that the Group is exposed to are as follows:
Motor insurance contracts (personal and commercial)
Claims experience is quite variable, due to a wide range of factors, but
the principal ones are age, sex and driving experience of the driver, type
and nature of vehicle, use of vehicle and area.
There are many sources of uncertainty that will affect the Group’s
experience under motor insurance, including operational risk, reserving
risk, premium rates not matching claims inflation rates, weather, the
social, economic and legislative environment and reinsurance failure risk.
Property insurance contracts (residential and commercial)
The major causes of claims for property insurance are theft, flood,
escape of water, fire, storm, subsidence and various types of accidental
damage.
The major source of uncertainty in the Group’s property contracts is the
volatility of weather. Over a longer period, the strength of the economy is
also a factor.
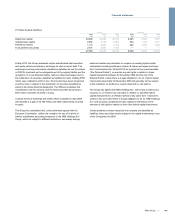
Other commercial insurance contracts
Other commercial claims come mainly from business interruption and
loss arising from the negligence of the insured (liability insurance).
Business interruption losses come from the loss of income, revenue
and/or profit as a result of property damage claims. Liability insurance
includes employers’ liability and public/products’ liability. Liability
insurance is written on an occurrence basis, and is subject to claims that
are identified over a substantial period of time, but where the loss event
occurred during the life of the policy.
Fluctuations in the social and economic climate are a source of
uncertainty in the Group’s business interruption and general liability
accounts. Other sources of uncertainty are changes in the law, or its
interpretation, and reserving risk. Other uncertainties are significant
events (for example terrorist attacks) and any emerging new heads of
damage or types of claim that are not envisaged when the policy is
written.
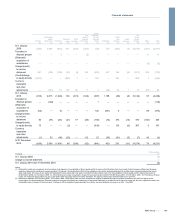
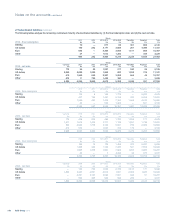
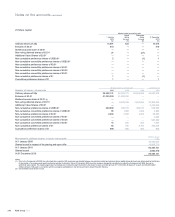
The following table shows the expected maturity of undiscounted
insurance liabilities up to 20 years, excluding those linked directly to the
financial assets backing these contracts (2010 - nil; 2009 - £4,175 million;
2008 - £4,189 million).
Group
0-3 months 3-12 months 1-3 years 3-5 years 5-10 years 10-20 years
£m £m £m £m £m £m
2010 724 1,503 1,821 898 734 442
2009 561 1,685 1,898 949 665 73
2008 623 1,645 1,899 903 487 53
RBS Group 2010348
Notes on the accounts continued