RBS 2010 Annual Report Download - page 166
Download and view the complete annual report
Please find page 166 of the 2010 RBS annual report below. You can navigate through the pages in the report by either clicking on the pages listed below, or by using the keyword search tool below to find specific information within the annual report.-
 1
1 -
2
-
3
-
4
-
5
-
6
-
7
-
8
-
9
-
10
-
11
-
12
-
13
-
14
-
15
-
16
-
17
-
18
-
19
-
20
-
21
-
22
-
23
-
24
-
25
-
26
-
27
-
28
-
29
-
30
-
31
-
32
-
33
-
34
-
35
-
36
-
37
-
38
-
39
-
40
-
41
-
42
-
43
-
44
-
45
-
46
-
47
-
48
-
49
-
50
-
51
-
52
-
53
-
54
-
55
-
56
-
57
-
58
-
59
-
60
-
61
-
62
-
63
-
64
-
65
-
66
-
67
-
68
-
69
-
70
-
71
-
72
-
73
-
74
-
75
-
76
-
77
-
78
-
79
-
80
-
81
-
82
-
83
-
84
-
85
-
86
-
87
-
88
-
89
-
90
-
91
-
92
-
93
-
94
-
95
-
96
-
97
-
98
-
99
-
100
-
101
-
102
-
103
-
104
-
105
-
106
-
107
-
108
-
109
-
110
-
111
-
112
-
113
-
114
-
115
-
116
-
117
-
118
-
119
-
120
-
121
-
122
-
123
-
124
-
125
-
126
-
127
-
128
-
129
-
130
-
131
-
132
-
133
-
134
-
135
-
136
-
137
-
138
-
139
-
140
-
141
-
142
-
143
-
144
-
145
-
146
-
147
-
148
-
149
-
150
-
151
-
152
-
153
-
154
-
155
-
 156
156 -
 157
157 -
 158
158 -
 159
159 -
 160
160 -
 161
161 -
 162
162 -
 163
163 -
 164
164 -
 165
165 -
 166
166 -
 167
167 -
 168
168 -
 169
169 -
 170
170 -
 171
171 -
 172
172 -
 173
173 -
 174
174 -
 175
175 -
 176
176 -
177
-
178
-
179
-
180
-
181
-
182
-
183
-
184
-
185
-
186
-
187
-
188
-
189
-
190
-
191
-
192
-
193
-
194
-
195
-
196
-
197
-
198
-
199
-
200
-
201
-
202
-
203
-
204
-
205
-
206
-
207
-
208
-
209
-
210
-
211
-
212
-
213
-
214
-
215
-
216
-
217
-
218
-
219
-
220
-
221
-
222
-
223
-
224
-
225
-
226
-
227
-
228
-
229
-
230
-
231
-
232
-
233
-
234
-
235
-
236
-
237
-
238
-
239
-
240
-
241
-
242
-
243
-
244
-
245
-
246
-
247
-
248
-
249
-
250
-
251
-
252
-
253
-
254
-
255
-
256
-
257
-
258
-
259
-
260
-
261
-
262
-
263
-
264
-
265
-
266
-
267
-
268
-
269
-
270
-
271
-
272
-
273
-
274
-
275
-
276
-
277
-
278
-
279
-
280
-
281
-
282
-
283
-
284
-
285
-
286
-
287
-
288
-
289
-
290
-
291
-
292
-
293
-
294
-
295
-
296
-
297
-
298
-
299
-
300
-
301
-
302
-
303
-
304
-
305
-
306
-
307
-
308
-
309
-
310
-
311
-
312
-
313
-
314
-
315
-
316
-
317
-
318
-
319
-
320
-
321
-
322
-
323
-
324
-
325
-
326
-
327
-
328
-
329
-
330
-
331
-
332
-
333
-
334
-
335
-
336
-
337
-
338
-
339
-
340
-
341
-
342
-
343
-
344
-
345
-
346
-
347
-
348
-
349
-
350
-
351
-
352
-
353
-
354
-
355
-
356
-
357
-
358
-
359
-
360
-
361
-
362
-
363
-
364
-
365
-
366
-
367
-
368
-
369
-
370
-
371
-
372
-
373
-
374
-
375
-
376
-
377
-
378
-
379
-
380
-
381
-
382
-
383
-
384
-
385
-
386
-
387
-
388
-
389
-
390
-
391
-
392
-
393
-
394
-
395
-
396
-
397
-
398
-
399
-
400
-
401
-
402
-
403
-
404
-
405
-
406
-
407
-
408
-
409
-
410
-
411
-
412
-
413
-
414
-
415
-
416
-
417
-
418
-
419
-
420
-
421
-
422
-
423
-
424
-
425
-
426
-
427
-
428
-
429
-
430
-
431
-
432
-
433
-
434
-
435
-
436
-
437
-
438
-
439
-
440
-
441
-
442
-
443
-
444
-
445
 |
 |

Risk management: Credit risk continued
Ulster Bank Group (Core and Non-Core)* continued
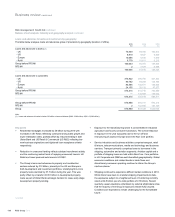
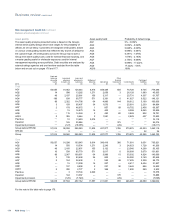
Residential mortgages
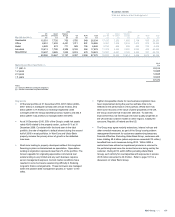
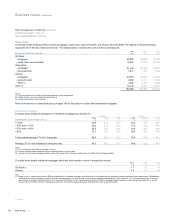
The table belowshows how the steep value correction has affected the distribution of residential mortgages by loan-to-value (LTV) (indexed). LTV is
based upon gross loan amounts and, whilst including defaulted loans, does not account for impairments already taken.
By average LTV (1) 2010
%
2009
%
2008
%
<= 50% 35.9 40.7 47.1
>50% and <= 70% 13.5 15.2 17.1
>70% and <= 90% 13.5 15.5 18.2
>90% 37.1 28.6 17.6
Total portfolio average LTV at 31 December 71.2 62.5 54.3
Average LTV on new originations during the year 75.9 72.8 71.1
Note:
(1) LTV averages calculated by transaction volume.
Key points
xThe residential mortgage portfolio across Ulster Bank Group totalled
£21.2 billion at 31 December 2010; with 90% in the Republic of
Ireland and 10% in Northern Ireland. The portfolio size has declined
by 4% in the Republic of Ireland since 31 December 2009 with
Northern Ireland increasing by 12% over the same period. New
business originations continue to be very low, especially in the
Republic of Ireland. In 2010, 3,557 new mortgages were originated
of which, 92% were in Northern Ireland.
xThe arrears rate continues to increase due to the continued
challenging economic environment. At 31 December 2010, the
arrears rate was 6.0%, compared to 3.3% at 31 December 2009. As
aresult, the impairment charge for 2010 was £336 million compared
with £116 million for 2009. Repossessions totalled 76 in 2010,
compared with 96 in 2009; 75% of the repossessions were voluntary.
xUlster Bank Group has a number of initiatives in place aimed at
increasing the level of support to customers experiencing temporary
financial difficulties. At 31 December 2010, forbearance
arrangements had been agreed in respect of 5.8% (£1.2 billion) of
Ulster Bank Group’s residential mortgage portfolio. The majority
(79%) relates to customers in the performing book. Loans in respect
of which forbearance arrangements were agreed during 2010
amounted to £1.7 billion in the performing book and £0.5 billion in
the impaired book.
*unaudited
RBS Group 2010164
Business review continued