RBS 2010 Annual Report Download - page 144
Download and view the complete annual report
Please find page 144 of the 2010 RBS annual report below. You can navigate through the pages in the report by either clicking on the pages listed below, or by using the keyword search tool below to find specific information within the annual report.-
 1
1 -
2
-
3
-
4
-
5
-
6
-
7
-
8
-
9
-
10
-
11
-
12
-
13
-
14
-
15
-
16
-
17
-
18
-
19
-
20
-
21
-
22
-
23
-
24
-
25
-
26
-
27
-
28
-
29
-
30
-
31
-
32
-
33
-
34
-
35
-
36
-
37
-
38
-
39
-
40
-
41
-
42
-
43
-
44
-
45
-
46
-
47
-
48
-
49
-
50
-
51
-
52
-
53
-
54
-
55
-
56
-
57
-
58
-
59
-
60
-
61
-
62
-
63
-
64
-
65
-
66
-
67
-
68
-
69
-
70
-
71
-
72
-
73
-
74
-
75
-
76
-
77
-
78
-
79
-
80
-
81
-
82
-
83
-
84
-
85
-
86
-
87
-
88
-
89
-
90
-
91
-
92
-
93
-
94
-
95
-
96
-
97
-
98
-
99
-
100
-
101
-
102
-
103
-
104
-
105
-
106
-
107
-
108
-
109
-
110
-
111
-
112
-
113
-
114
-
115
-
116
-
117
-
118
-
119
-
120
-
121
-
122
-
123
-
124
-
125
-
126
-
127
-
128
-
129
-
130
-
131
-
132
-
133
-
 134
134 -
 135
135 -
 136
136 -
 137
137 -
 138
138 -
 139
139 -
 140
140 -
 141
141 -
 142
142 -
 143
143 -
 144
144 -
 145
145 -
 146
146 -
 147
147 -
 148
148 -
 149
149 -
 150
150 -
 151
151 -
 152
152 -
 153
153 -
 154
154 -
155
-
156
-
157
-
158
-
159
-
160
-
161
-
162
-
163
-
164
-
165
-
166
-
167
-
168
-
169
-
170
-
171
-
172
-
173
-
174
-
175
-
176
-
177
-
178
-
179
-
180
-
181
-
182
-
183
-
184
-
185
-
186
-
187
-
188
-
189
-
190
-
191
-
192
-
193
-
194
-
195
-
196
-
197
-
198
-
199
-
200
-
201
-
202
-
203
-
204
-
205
-
206
-
207
-
208
-
209
-
210
-
211
-
212
-
213
-
214
-
215
-
216
-
217
-
218
-
219
-
220
-
221
-
222
-
223
-
224
-
225
-
226
-
227
-
228
-
229
-
230
-
231
-
232
-
233
-
234
-
235
-
236
-
237
-
238
-
239
-
240
-
241
-
242
-
243
-
244
-
245
-
246
-
247
-
248
-
249
-
250
-
251
-
252
-
253
-
254
-
255
-
256
-
257
-
258
-
259
-
260
-
261
-
262
-
263
-
264
-
265
-
266
-
267
-
268
-
269
-
270
-
271
-
272
-
273
-
274
-
275
-
276
-
277
-
278
-
279
-
280
-
281
-
282
-
283
-
284
-
285
-
286
-
287
-
288
-
289
-
290
-
291
-
292
-
293
-
294
-
295
-
296
-
297
-
298
-
299
-
300
-
301
-
302
-
303
-
304
-
305
-
306
-
307
-
308
-
309
-
310
-
311
-
312
-
313
-
314
-
315
-
316
-
317
-
318
-
319
-
320
-
321
-
322
-
323
-
324
-
325
-
326
-
327
-
328
-
329
-
330
-
331
-
332
-
333
-
334
-
335
-
336
-
337
-
338
-
339
-
340
-
341
-
342
-
343
-
344
-
345
-
346
-
347
-
348
-
349
-
350
-
351
-
352
-
353
-
354
-
355
-
356
-
357
-
358
-
359
-
360
-
361
-
362
-
363
-
364
-
365
-
366
-
367
-
368
-
369
-
370
-
371
-
372
-
373
-
374
-
375
-
376
-
377
-
378
-
379
-
380
-
381
-
382
-
383
-
384
-
385
-
386
-
387
-
388
-
389
-
390
-
391
-
392
-
393
-
394
-
395
-
396
-
397
-
398
-
399
-
400
-
401
-
402
-
403
-
404
-
405
-
406
-
407
-
408
-
409
-
410
-
411
-
412
-
413
-
414
-
415
-
416
-
417
-
418
-
419
-
420
-
421
-
422
-
423
-
424
-
425
-
426
-
427
-
428
-
429
-
430
-
431
-
432
-
433
-
434
-
435
-
436
-
437
-
438
-
439
-
440
-
441
-
442
-
443
-
444
-
445
 |
 |

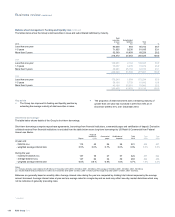
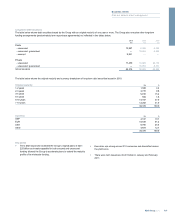
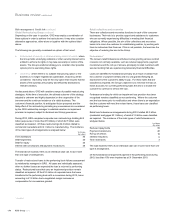
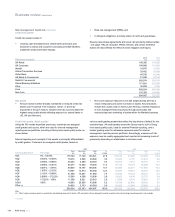
Balance sheet management: Funding and liquidity risk continued
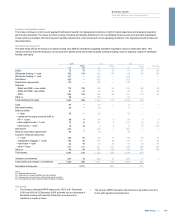
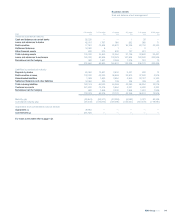
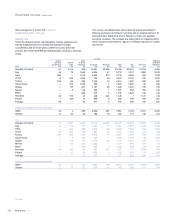
Assets and liabilities by contractual cashflow maturity continued
0-3 months 3-12 months 1-3 years 3-5 years 5-10 years 10-20 years
2008 £m £m £m £m £m £m
Assets by contractual maturity
Cash and balances at central banks 12,333 25 — — 2 29
Loans and advances to banks 61,630 19,369 2,673 921 111 70
Debt securities 26,006 12,895 24,629 23,927 57,846 24,535
Settlement balances 17,830 — — — 2 —
Other financial assets 621 193 58 111 343 —
Total maturing assets 118,420 32,482 27,360 24,959 58,304 24,634
Loans and advances to customers 195,553 81,054 138,378 125,621 160,271 152,084
Derivatives held for hedging 266 1,796 2,281 1,359 1,517 649
314,239 115,332 168,019 151,939 220,092 177,367
Liabilities by contractual maturity
Deposits by banks 154,614 14,347 3,345 2,754 2,048 34
Debt securities in issue 131,714 48,652 40,067 38,223 38,667 5,626
Subordinated liabilities 1,753 4,271 6,824 5,793 24,503 13,030
Settlement balances and other liabilities 13,351 5 12 6 10 6
Total maturing liabilities 301,432 67,275 50,248 46,776 65,228 18,696
Customer accounts 523,268 33,450 6,577 6,337 7,298 5,319
Derivatives held for hedging 394 2,216 2,543 1,334 2,682 1,373
825,094 102,941 59,368 54,447 75,208 25,388
Maturity gap (183,012) (34,793) (22,888) (21,817) (6,924) 5,938
Cumulative maturity gap (183,012) (217,805) (240,693) (262,510) (269,434) (263,496)
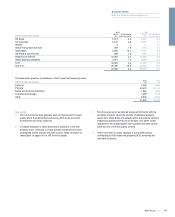
Notes:
(1) The Group is only called upon to satisfy a guarantee when the guaranteed party fails to meet its obligations. The Group expects most guarantees it provides to expire unused.
(2) The Group has given commitments to provide funds to customers under undrawn formal facilities, credit lines and other commitments to lend subject to certain conditions being met by the
counterparty. The Group does not expect all facilities to be drawn, and some may lapse before drawdown.
The tables above have been prepared on the following basis:
The contractual maturity of on-balance sheet assets and liabilities above
highlight the maturity transformation which underpins the role of banks to
lend long-term but funded predominantly by short-term liabilities such as
customer deposits. This is achieved through the diversified funding
franchise of the Group across an extensive retail, wealth and SME
customer base, and across a wide geographic network. In practice, the
behavioural profile of many assets and liabilities exhibit greater stability
and longer maturity than the contractual maturity.
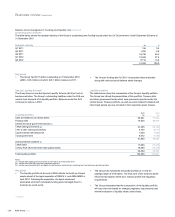
Financial assets have been reflected in the time band of the latest date
on which they could be repaid, unless earlier repayment can be
demanded by the Group. Financial liabilities are included at the earliest
date on which the counterparty can require repayment regardless of
whether or not such early repayment results in a penalty. If the
repayment of a financial instrument is triggered by, or is subject to,
specific criteria such as market price hurdles being reached, the asset is
included in the time band which contains the latest date on which it can
be repaid regardless of early repayment. The liability is included in the
time band which contains the earliest possible date that the conditions
could be fulfilled without considering the probability of the conditions
being met.
For example, if a structured note is automatically prepaid when an equity
index exceeds a certain level, the cash outflow will be included in the less
than three months period whatever the level of the index at the year end.
The settlement date of debt securities in issue, issued by certain
securitisation vehicles consolidated by the Group, depends on when cash
flows are received from the securitised assets. Where these assets are
prepayable, the timing of the cash outflow relating to securities assumes
that each asset will be prepaid at the earliest possible date. As the
repayment of assets and liabilities are linked, the repayment of assets in
securitisations are shown on the earliest date that the asset can be
prepaid as this is the basis used for liabilities.
Assets and liabilities with a contractual maturity of greater than twenty
years - the principal amounts of financial assets and liabilities that are
repayable after twenty years or where the counterparty has no right to
repayment of the principal are excluded from the table, as are interest
payments after twenty years.
Held-for-trading assets and liabilities amounting to £665 billion (assets)
and £586 billion (liabilities) (2009 - £651 billion assets, £568 billion
liabilities; 2008 - £1,227 billion assets, £1,147 billion liabilities) have been
excluded from the table in view of their short-term nature.
RBS Group 2010142
Business review continued