RBS 2010 Annual Report Download - page 322
Download and view the complete annual report
Please find page 322 of the 2010 RBS annual report below. You can navigate through the pages in the report by either clicking on the pages listed below, or by using the keyword search tool below to find specific information within the annual report.-
 1
1 -
2
-
3
-
4
-
5
-
6
-
7
-
8
-
9
-
10
-
11
-
12
-
13
-
14
-
15
-
16
-
17
-
18
-
19
-
20
-
21
-
22
-
23
-
24
-
25
-
26
-
27
-
28
-
29
-
30
-
31
-
32
-
33
-
34
-
35
-
36
-
37
-
38
-
39
-
40
-
41
-
42
-
43
-
44
-
45
-
46
-
47
-
48
-
49
-
50
-
51
-
52
-
53
-
54
-
55
-
56
-
57
-
58
-
59
-
60
-
61
-
62
-
63
-
64
-
65
-
66
-
67
-
68
-
69
-
70
-
71
-
72
-
73
-
74
-
75
-
76
-
77
-
78
-
79
-
80
-
81
-
82
-
83
-
84
-
85
-
86
-
87
-
88
-
89
-
90
-
91
-
92
-
93
-
94
-
95
-
96
-
97
-
98
-
99
-
100
-
101
-
102
-
103
-
104
-
105
-
106
-
107
-
108
-
109
-
110
-
111
-
112
-
113
-
114
-
115
-
116
-
117
-
118
-
119
-
120
-
121
-
122
-
123
-
124
-
125
-
126
-
127
-
128
-
129
-
130
-
131
-
132
-
133
-
134
-
135
-
136
-
137
-
138
-
139
-
140
-
141
-
142
-
143
-
144
-
145
-
146
-
147
-
148
-
149
-
150
-
151
-
152
-
153
-
154
-
155
-
156
-
157
-
158
-
159
-
160
-
161
-
162
-
163
-
164
-
165
-
166
-
167
-
168
-
169
-
170
-
171
-
172
-
173
-
174
-
175
-
176
-
177
-
178
-
179
-
180
-
181
-
182
-
183
-
184
-
185
-
186
-
187
-
188
-
189
-
190
-
191
-
192
-
193
-
194
-
195
-
196
-
197
-
198
-
199
-
200
-
201
-
202
-
203
-
204
-
205
-
206
-
207
-
208
-
209
-
210
-
211
-
212
-
213
-
214
-
215
-
216
-
217
-
218
-
219
-
220
-
221
-
222
-
223
-
224
-
225
-
226
-
227
-
228
-
229
-
230
-
231
-
232
-
233
-
234
-
235
-
236
-
237
-
238
-
239
-
240
-
241
-
242
-
243
-
244
-
245
-
246
-
247
-
248
-
249
-
250
-
251
-
252
-
253
-
254
-
255
-
256
-
257
-
258
-
259
-
260
-
261
-
262
-
263
-
264
-
265
-
266
-
267
-
268
-
269
-
270
-
271
-
272
-
273
-
274
-
275
-
276
-
277
-
278
-
279
-
280
-
281
-
282
-
283
-
284
-
285
-
286
-
287
-
288
-
289
-
290
-
291
-
292
-
293
-
294
-
295
-
296
-
297
-
298
-
299
-
300
-
301
-
302
-
303
-
304
-
305
-
306
-
307
-
308
-
309
-
310
-
311
-
 312
312 -
 313
313 -
 314
314 -
 315
315 -
 316
316 -
 317
317 -
 318
318 -
 319
319 -
 320
320 -
 321
321 -
 322
322 -
 323
323 -
 324
324 -
 325
325 -
 326
326 -
 327
327 -
 328
328 -
 329
329 -
 330
330 -
 331
331 -
 332
332 -
333
-
334
-
335
-
336
-
337
-
338
-
339
-
340
-
341
-
342
-
343
-
344
-
345
-
346
-
347
-
348
-
349
-
350
-
351
-
352
-
353
-
354
-
355
-
356
-
357
-
358
-
359
-
360
-
361
-
362
-
363
-
364
-
365
-
366
-
367
-
368
-
369
-
370
-
371
-
372
-
373
-
374
-
375
-
376
-
377
-
378
-
379
-
380
-
381
-
382
-
383
-
384
-
385
-
386
-
387
-
388
-
389
-
390
-
391
-
392
-
393
-
394
-
395
-
396
-
397
-
398
-
399
-
400
-
401
-
402
-
403
-
404
-
405
-
406
-
407
-
408
-
409
-
410
-
411
-
412
-
413
-
414
-
415
-
416
-
417
-
418
-
419
-
420
-
421
-
422
-
423
-
424
-
425
-
426
-
427
-
428
-
429
-
430
-
431
-
432
-
433
-
434
-
435
-
436
-
437
-
438
-
439
-
440
-
441
-
442
-
443
-
444
-
445
 |
 |
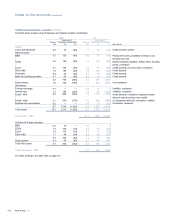
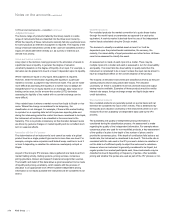
12 Financial instruments - valuation continued
Commercial mortgage backed securities
CMBS are valued using an industry standard model and the inputs,
where possible, are corroborated using observable market data.
Collateralised debt obligations
CDOs purchased from third-parties are valued using independent, third-
party quotes or independent lead manager indicative prices. For super
senior CDOs which have been originated by the Group no specific third-
party information is available. The valuation of these super senior CDOs
therefore takes into consideration outputs from a proprietary model,
market data and appropriate valuation adjustments.
Acollateral net asset value methodology using dealer buy side marks is
used to determine an upper bound for super senior CDO valuations. An
ABS index implied collateral valuation is also used to provide a market
calibrated valuation data point. Both the ABS index implied valuation and
the collateral net asset value methodology apply an assumed immediate
liquidation approach.
Collateralised loan obligations
To determine the fair value of CLOs purchased from third parties, the
Group uses third-party broker or lead manager quotes as the primary
pricing source. These quotes are benchmarked to consensus pricing
sources where they are available.
For CLOs originated and still held by the Group, the fair value is
determined using a correlation model based on a Monte Carlo simulation
framework. The main model inputs are credit spreads and recovery rates
of the underlying assets and their correlation. A credit curve is assigned
to each underlying asset based on prices from third-party dealer quotes
and cash flow profiles, sourced from an industry standard model. Losses
are calculated taking into account the attachment and detachment point
of the exposure. Where the correlation inputs to this model are not
observable, CLOs are classified as level 3.
Other asset-backed and corporate debt securities
Where observable market prices for a particular debt security are not
available, the fair value will typically be determined with reference to
observable market transactions in other related products, such as similar
debt securities or credit derivatives. Assumptions are made about the
relationship between the individual debt security and the available
benchmark data. Where significant management judgment has been
applied in identifying the most relevant related product, or in determining
the relationship between the related product and the instrument itself, the
instrument is classified as level 3.
Equity shares
Private equityinvestments include unit holdings and limited partnership
interests primarily in corporate private equity funds, debt funds and fund
of hedge funds. Externally managed funds are valued using recent prices
where available. Where not available, the fair value of investments in
externally managed funds is generally determined using statements or
other information provided by the fund managers.
The Group considers that valuations may rely significantly on the
judgments and estimates made by the fund managers, particularly in
assessing private equity components. Given the decline in liquidity in
world markets, and the level of subjectivity, these are included in level 3.
Derivatives
Derivatives are priced using quoted prices for the same or similar
instruments where these are available. However, the majority of
derivatives are valued using pricing models. Inputs for these models are
usually observed directly in the market, or derived from observed prices.
However, it is not always possible to observe or corroborate all model
inputs. Unobservable inputs used are based on estimates taking into
account a range of available information including historic analysis,
historic traded levels, market practice, comparison to other relevant
benchmark observable data and consensus pricing data.
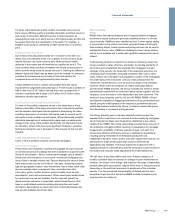
Credit derivatives - APS
The Group purchased credit protection over a portfolio of specified assets
and exposures (covered assets) from HMT. The Group has a right to
terminate the APS at any time provided that the Financial Services
Authority has confirmed in writing to HMT that it has no objection to the
proposed termination. On termination the Group must pay HMT the
higher of the regulatory capital relief received and £2.5 billion less
premiums paid plus the aggregate of amounts received from the UK
Government under the APS. In consideration for the protection provided
by the APS, the Group paid an initial premium of £1.4 billion on 31
December 2009. A further premium of £700 million was paid on 31
December 2010. Quarterly premiums of £125 million will be payable from
31 December 2011 and subsequently until the earlier of 2099 and the
termination of the agreement.
The APS is a single contract providing credit protection in respect of the
covered assets. Under IFRS, credit protection is treated either as a
financial guarantee contract or as a derivative financial instrument
depending on the terms of the agreement and the nature of the protected
assets and exposures. The Group has concluded, principally because the
covered portfolio includes significant exposure in the form of derivatives,
that the APS does not meet the criteria to be treated as a financial
guarantee contract. The contract has therefore been accounted for as a
derivative financial instrument. It was recognised initially and measured
subsequently at fair value with changes in fair value recognised in profit
or loss within income from trading activities. There is no change in the
recognition and measurement of the covered assets as a result of the
APS.
Where protection is provided on a particular seniority of exposure, as is
the case with the APS, which requires initial losses to be taken by the
Group, it is termed ‘tranched’ protection. The model being used to value
the APS - a Gaussian Copula model with stochastic recoveries - is used
by the Group to value tranches traded by the exotic credit desk and is a
model that is currently used within the wider market.
The option to exit the APS is not usually present in such tranched trades
and consequently, there is no standard market practice for reflecting this
part of the trade within the standard model framework. The approach that
has been adopted assumes that the Group will not exit the trade before
the minimum level of fees has been paid and at this point it will be clear
whether it should exit the trade or not. The APS derivative is valued as
the payment of the minimum level of fees in return for protection receipts
which are in excess of both the first loss and the total future premiums.
RBS Group 2010320
Notes on the accounts continued