RBS 2010 Annual Report Download - page 73
Download and view the complete annual report
Please find page 73 of the 2010 RBS annual report below. You can navigate through the pages in the report by either clicking on the pages listed below, or by using the keyword search tool below to find specific information within the annual report.-
 1
1 -
2
-
3
-
4
-
5
-
6
-
7
-
8
-
9
-
10
-
11
-
12
-
13
-
14
-
15
-
16
-
17
-
18
-
19
-
20
-
21
-
22
-
23
-
24
-
25
-
26
-
27
-
28
-
29
-
30
-
31
-
32
-
33
-
34
-
35
-
36
-
37
-
38
-
39
-
40
-
41
-
42
-
43
-
44
-
45
-
46
-
47
-
48
-
49
-
50
-
51
-
52
-
53
-
54
-
55
-
56
-
57
-
58
-
59
-
60
-
61
-
62
-
 63
63 -
 64
64 -
 65
65 -
 66
66 -
 67
67 -
 68
68 -
 69
69 -
 70
70 -
 71
71 -
 72
72 -
 73
73 -
 74
74 -
 75
75 -
 76
76 -
 77
77 -
 78
78 -
 79
79 -
 80
80 -
 81
81 -
 82
82 -
 83
83 -
84
-
85
-
86
-
87
-
88
-
89
-
90
-
91
-
92
-
93
-
94
-
95
-
96
-
97
-
98
-
99
-
100
-
101
-
102
-
103
-
104
-
105
-
106
-
107
-
108
-
109
-
110
-
111
-
112
-
113
-
114
-
115
-
116
-
117
-
118
-
119
-
120
-
121
-
122
-
123
-
124
-
125
-
126
-
127
-
128
-
129
-
130
-
131
-
132
-
133
-
134
-
135
-
136
-
137
-
138
-
139
-
140
-
141
-
142
-
143
-
144
-
145
-
146
-
147
-
148
-
149
-
150
-
151
-
152
-
153
-
154
-
155
-
156
-
157
-
158
-
159
-
160
-
161
-
162
-
163
-
164
-
165
-
166
-
167
-
168
-
169
-
170
-
171
-
172
-
173
-
174
-
175
-
176
-
177
-
178
-
179
-
180
-
181
-
182
-
183
-
184
-
185
-
186
-
187
-
188
-
189
-
190
-
191
-
192
-
193
-
194
-
195
-
196
-
197
-
198
-
199
-
200
-
201
-
202
-
203
-
204
-
205
-
206
-
207
-
208
-
209
-
210
-
211
-
212
-
213
-
214
-
215
-
216
-
217
-
218
-
219
-
220
-
221
-
222
-
223
-
224
-
225
-
226
-
227
-
228
-
229
-
230
-
231
-
232
-
233
-
234
-
235
-
236
-
237
-
238
-
239
-
240
-
241
-
242
-
243
-
244
-
245
-
246
-
247
-
248
-
249
-
250
-
251
-
252
-
253
-
254
-
255
-
256
-
257
-
258
-
259
-
260
-
261
-
262
-
263
-
264
-
265
-
266
-
267
-
268
-
269
-
270
-
271
-
272
-
273
-
274
-
275
-
276
-
277
-
278
-
279
-
280
-
281
-
282
-
283
-
284
-
285
-
286
-
287
-
288
-
289
-
290
-
291
-
292
-
293
-
294
-
295
-
296
-
297
-
298
-
299
-
300
-
301
-
302
-
303
-
304
-
305
-
306
-
307
-
308
-
309
-
310
-
311
-
312
-
313
-
314
-
315
-
316
-
317
-
318
-
319
-
320
-
321
-
322
-
323
-
324
-
325
-
326
-
327
-
328
-
329
-
330
-
331
-
332
-
333
-
334
-
335
-
336
-
337
-
338
-
339
-
340
-
341
-
342
-
343
-
344
-
345
-
346
-
347
-
348
-
349
-
350
-
351
-
352
-
353
-
354
-
355
-
356
-
357
-
358
-
359
-
360
-
361
-
362
-
363
-
364
-
365
-
366
-
367
-
368
-
369
-
370
-
371
-
372
-
373
-
374
-
375
-
376
-
377
-
378
-
379
-
380
-
381
-
382
-
383
-
384
-
385
-
386
-
387
-
388
-
389
-
390
-
391
-
392
-
393
-
394
-
395
-
396
-
397
-
398
-
399
-
400
-
401
-
402
-
403
-
404
-
405
-
406
-
407
-
408
-
409
-
410
-
411
-
412
-
413
-
414
-
415
-
416
-
417
-
418
-
419
-
420
-
421
-
422
-
423
-
424
-
425
-
426
-
427
-
428
-
429
-
430
-
431
-
432
-
433
-
434
-
435
-
436
-
437
-
438
-
439
-
440
-
441
-
442
-
443
-
444
-
445
 |
 |

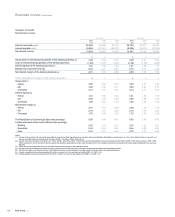
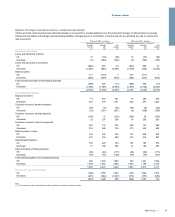
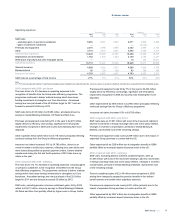
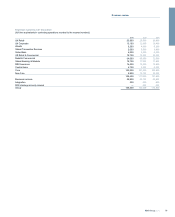
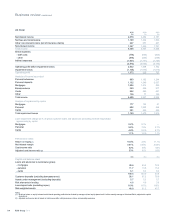
Operating expenses
Pro forma (1) Statutory
2010 2009 2008 2010 2009 2008
£m £m £m £m £m £m
Staff costs
-excluding gains on pensions curtailment 8,956 9,081 7,990 9,671 9,993 8,898
- gains on pensions curtailment —— — —(2,148) —
Premises and equipment 2,276 2,468 2,099 2,402 2,594 2,163
Other 3,716 3,979 4,267 3,995 4,449 4,716
Administrative expenses 14,948 15,528 14,356 16,068 14,888 15,777
Depreciation and amortisation 1,762 1,873 1,832 2,150 2,166 2,377
Write-down of goodwill and other intangible assets —— — 10 363 16,911
Operating expenses 16,710 17,401 16,188 18,228 17,417 35,065
General insurance 4,698 4,223 3,733 4,698 4,223 3,733
Bancassurance 85 134 184 85 134 184
Insurance net claims 4,783 4,357 3,917 4,783 4,357 3,917
Staff costs as a percentage of total income 27% 31% 41% 30% 30% 43%
Note:
(1) Pro forma excludes amortisation of purchased intangible assets, integration and restructuring costs, bonus tax, gains on pensions curtailment and write-down of goodwill and other intangible assets.
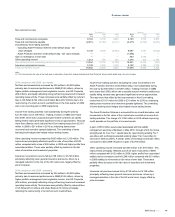
2010 compared with 2009 - pro forma
The main driver of a 4% decrease in operating expenses is the
recognition of benefits from the Group-wide efficiency programme. The
programme continues to deliver material savings which have been
funding investments to strengthen our Core franchises. Annualised
savings are now just ahead of the £2.5 billion target for 2011 and are
forecast to exceed £3 billion by 2013.
Staff costs fell by £125 million to £8,956 million, principally driven by
savings in Global Banking & Markets, UK Retail and Non-Core.
Premises and equipment costs fell by 8% in the year to £2,276 million
largely driven by efficiency cost savings, significant one-off property
impairments recognised in 2009 and country exits following Non-Core
disposals.
Other expenses fell by £263 million to £3,716 million principally reflecting
continued savings from the Group’s efficiency programme.
Insurance net claims increased 10% to £4,783 million, driven by an
overall increase in bodily injury reserves, reflecting prior year claims and
more claims being settled as periodic payment orders. Severe weather
experienced during the first and fourth quarters of 2010 also drove up
claims in the year.
2010 compared with 2009 - statutory
The main driver of a 7% decrease in operating expenses, excluding gains
on pensions curtailment, is the recognition of benefits from the Group-
wide efficiency programme. The programme continues to deliver material
savings which have been funding investments to strengthen our Core
franchises. Annualised savings are now just ahead of the £2.5 billion
target for 2011 and are forecast to exceed £3 billion by 2013.
Staff costs, excluding pension schemes curtailment gains, fell by £322
million to £9,671 million, driven by savings in Global Banking & Markets,
UK Retail and Non-Core partially offset by higher costs in Group Centre.
Premises and equipment costs fell by 7% in the year to £2,402 million
largely driven by efficiency cost savings, significant one-off property
impairments recognised in 2009 and country exits following Non-Core
disposals.
Other expenses fell by £454 million to £3,995 million principally reflecting
continued savings from the Group’s efficiency programme.
Insurance net claims increased 10% to £4,783 million.
2009 compared with 2008 - pro forma
Staff costs were up £1,091 million with most of the movement relating to
adverse movements in foreign exchange rates and some salary inflation.
Changes in incentive compensation, primarily in Global Banking &
Markets, represented most of the remaining change.
Premises and equipment costs rose by £369 million due to the impact of
expanded Group premises in London and the US.
Other expenses fell by £288 million due to integration benefits in GBM
partially offset by increased deposit insurance levies in the US.
2009 compared with 2008 - statutory
Staff costs, excluding pension schemes curtailment gains, were up
£1,095 million with most of the movement relating to adverse movements
in foreign exchange rates and some salary inflation. Changes in incentive
compensation, primarily in Global Banking & Markets, represented most
of the remaining change.
Pension curtailment gains of £2,148 million were recognised in 2009
arising from changes to prospective pension benefits in the defined
benefit scheme and certain other subsidiary schemes.
Premises and equipment costs rose by £431 million primarily due to the
impact of expanded Group premises in London and the US.
Other expenses fell by £267 million due to integration benefits in GBM
partially offset by increased deposit insurance levies in the US.
71RBS Group 2010
Business review