RBS 2010 Annual Report Download - page 306
Download and view the complete annual report
Please find page 306 of the 2010 RBS annual report below. You can navigate through the pages in the report by either clicking on the pages listed below, or by using the keyword search tool below to find specific information within the annual report.-
 1
1 -
2
-
3
-
4
-
5
-
6
-
7
-
8
-
9
-
10
-
11
-
12
-
13
-
14
-
15
-
16
-
17
-
18
-
19
-
20
-
21
-
22
-
23
-
24
-
25
-
26
-
27
-
28
-
29
-
30
-
31
-
32
-
33
-
34
-
35
-
36
-
37
-
38
-
39
-
40
-
41
-
42
-
43
-
44
-
45
-
46
-
47
-
48
-
49
-
50
-
51
-
52
-
53
-
54
-
55
-
56
-
57
-
58
-
59
-
60
-
61
-
62
-
63
-
64
-
65
-
66
-
67
-
68
-
69
-
70
-
71
-
72
-
73
-
74
-
75
-
76
-
77
-
78
-
79
-
80
-
81
-
82
-
83
-
84
-
85
-
86
-
87
-
88
-
89
-
90
-
91
-
92
-
93
-
94
-
95
-
96
-
97
-
98
-
99
-
100
-
101
-
102
-
103
-
104
-
105
-
106
-
107
-
108
-
109
-
110
-
111
-
112
-
113
-
114
-
115
-
116
-
117
-
118
-
119
-
120
-
121
-
122
-
123
-
124
-
125
-
126
-
127
-
128
-
129
-
130
-
131
-
132
-
133
-
134
-
135
-
136
-
137
-
138
-
139
-
140
-
141
-
142
-
143
-
144
-
145
-
146
-
147
-
148
-
149
-
150
-
151
-
152
-
153
-
154
-
155
-
156
-
157
-
158
-
159
-
160
-
161
-
162
-
163
-
164
-
165
-
166
-
167
-
168
-
169
-
170
-
171
-
172
-
173
-
174
-
175
-
176
-
177
-
178
-
179
-
180
-
181
-
182
-
183
-
184
-
185
-
186
-
187
-
188
-
189
-
190
-
191
-
192
-
193
-
194
-
195
-
196
-
197
-
198
-
199
-
200
-
201
-
202
-
203
-
204
-
205
-
206
-
207
-
208
-
209
-
210
-
211
-
212
-
213
-
214
-
215
-
216
-
217
-
218
-
219
-
220
-
221
-
222
-
223
-
224
-
225
-
226
-
227
-
228
-
229
-
230
-
231
-
232
-
233
-
234
-
235
-
236
-
237
-
238
-
239
-
240
-
241
-
242
-
243
-
244
-
245
-
246
-
247
-
248
-
249
-
250
-
251
-
252
-
253
-
254
-
255
-
256
-
257
-
258
-
259
-
260
-
261
-
262
-
263
-
264
-
265
-
266
-
267
-
268
-
269
-
270
-
271
-
272
-
273
-
274
-
275
-
276
-
277
-
278
-
279
-
280
-
281
-
282
-
283
-
284
-
285
-
286
-
287
-
288
-
289
-
290
-
291
-
292
-
293
-
294
-
295
-
 296
296 -
 297
297 -
 298
298 -
 299
299 -
 300
300 -
 301
301 -
 302
302 -
 303
303 -
 304
304 -
 305
305 -
 306
306 -
 307
307 -
 308
308 -
 309
309 -
 310
310 -
 311
311 -
 312
312 -
 313
313 -
 314
314 -
 315
315 -
 316
316 -
317
-
318
-
319
-
320
-
321
-
322
-
323
-
324
-
325
-
326
-
327
-
328
-
329
-
330
-
331
-
332
-
333
-
334
-
335
-
336
-
337
-
338
-
339
-
340
-
341
-
342
-
343
-
344
-
345
-
346
-
347
-
348
-
349
-
350
-
351
-
352
-
353
-
354
-
355
-
356
-
357
-
358
-
359
-
360
-
361
-
362
-
363
-
364
-
365
-
366
-
367
-
368
-
369
-
370
-
371
-
372
-
373
-
374
-
375
-
376
-
377
-
378
-
379
-
380
-
381
-
382
-
383
-
384
-
385
-
386
-
387
-
388
-
389
-
390
-
391
-
392
-
393
-
394
-
395
-
396
-
397
-
398
-
399
-
400
-
401
-
402
-
403
-
404
-
405
-
406
-
407
-
408
-
409
-
410
-
411
-
412
-
413
-
414
-
415
-
416
-
417
-
418
-
419
-
420
-
421
-
422
-
423
-
424
-
425
-
426
-
427
-
428
-
429
-
430
-
431
-
432
-
433
-
434
-
435
-
436
-
437
-
438
-
439
-
440
-
441
-
442
-
443
-
444
-
445
 |
 |

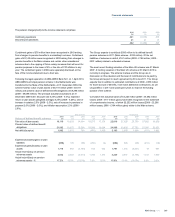
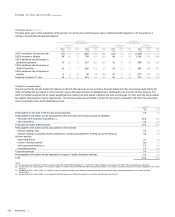
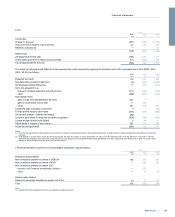
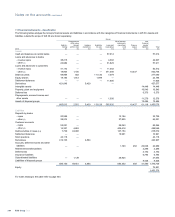
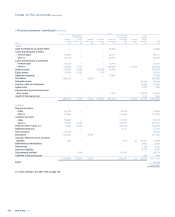
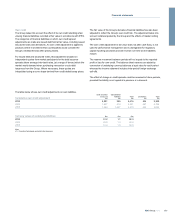
11 Financial instruments - classification continued
The following tables analyse the company's financial assets and financial liabilities in accordance with the categories of financial instruments in IAS 39.
Assets and liabilities outside the scope of IAS 39 are shown separately.
Company
Held-for-
trading
Hedging
derivatives
Loans and
receivables
Other
financial
instruments
(amortised cost)
Non
financial assets/
liabilities Total
2010 £m £m £m £m £m £m
Assets
Loans and advances to banks (1) — 19,535 19,535
Loans and advances to customers (2) —6,689 6,689
Debt securities (2) —1,454 1,454
Investments in Group undertakings 49,125 49,125
Derivatives (2) 1,223 252 1,475
Deferred tax 2 2
Prepayments, accrued income and other assets — — 28 28
1,223 252 27,678 — 49,155 78,308
Liabilities
Customer accounts (4) —1,029 1,029
Debt securities in issue —8,742 8,742
Derivatives (4) 231 — 231
Accruals, deferred income and other liabilities — — 1,034 1,034
Subordinated liabilities —8,048 8,048
231 — 17,819 1,034 19,084
Equity 59,224
78,308
2009
Assets
Loans and advances to banks (1) —31,238 31,238
Loans and advances to customers (2) —2,777 2,777
Debt securities (2) —1,286 1,286
Investments in Group undertakings 64,766 64,766
Settlement balances 11 11
Derivatives (2) 930 239 1,169
Deferred tax 2 2
Prepayments, accrued income and other assets — — 43 43
930 239 35,301 64,822 101,292
Liabilities
Deposits by banks (3) —93 93
Customer accounts (4) —13,264 13,264
Debt securities in issue —11,788 11,788
Derivatives (4) 432 14 446
Accruals, deferred income and other liabilities — — 1,357 1,357
Subordinated liabilities —8,762 8,762
432 14 33,907 1,357 35,710
Equity 65,582
101,292
For notes relating to this table refer to page 305.
RBS Group 2010304
Notes on the accounts continued