RBS 2010 Annual Report Download - page 157
Download and view the complete annual report
Please find page 157 of the 2010 RBS annual report below. You can navigate through the pages in the report by either clicking on the pages listed below, or by using the keyword search tool below to find specific information within the annual report.-
 1
1 -
2
-
3
-
4
-
5
-
6
-
7
-
8
-
9
-
10
-
11
-
12
-
13
-
14
-
15
-
16
-
17
-
18
-
19
-
20
-
21
-
22
-
23
-
24
-
25
-
26
-
27
-
28
-
29
-
30
-
31
-
32
-
33
-
34
-
35
-
36
-
37
-
38
-
39
-
40
-
41
-
42
-
43
-
44
-
45
-
46
-
47
-
48
-
49
-
50
-
51
-
52
-
53
-
54
-
55
-
56
-
57
-
58
-
59
-
60
-
61
-
62
-
63
-
64
-
65
-
66
-
67
-
68
-
69
-
70
-
71
-
72
-
73
-
74
-
75
-
76
-
77
-
78
-
79
-
80
-
81
-
82
-
83
-
84
-
85
-
86
-
87
-
88
-
89
-
90
-
91
-
92
-
93
-
94
-
95
-
96
-
97
-
98
-
99
-
100
-
101
-
102
-
103
-
104
-
105
-
106
-
107
-
108
-
109
-
110
-
111
-
112
-
113
-
114
-
115
-
116
-
117
-
118
-
119
-
120
-
121
-
122
-
123
-
124
-
125
-
126
-
127
-
128
-
129
-
130
-
131
-
132
-
133
-
134
-
135
-
136
-
137
-
138
-
139
-
140
-
141
-
142
-
143
-
144
-
145
-
146
-
 147
147 -
 148
148 -
 149
149 -
 150
150 -
 151
151 -
 152
152 -
 153
153 -
 154
154 -
 155
155 -
 156
156 -
 157
157 -
 158
158 -
 159
159 -
 160
160 -
 161
161 -
 162
162 -
 163
163 -
 164
164 -
 165
165 -
 166
166 -
 167
167 -
168
-
169
-
170
-
171
-
172
-
173
-
174
-
175
-
176
-
177
-
178
-
179
-
180
-
181
-
182
-
183
-
184
-
185
-
186
-
187
-
188
-
189
-
190
-
191
-
192
-
193
-
194
-
195
-
196
-
197
-
198
-
199
-
200
-
201
-
202
-
203
-
204
-
205
-
206
-
207
-
208
-
209
-
210
-
211
-
212
-
213
-
214
-
215
-
216
-
217
-
218
-
219
-
220
-
221
-
222
-
223
-
224
-
225
-
226
-
227
-
228
-
229
-
230
-
231
-
232
-
233
-
234
-
235
-
236
-
237
-
238
-
239
-
240
-
241
-
242
-
243
-
244
-
245
-
246
-
247
-
248
-
249
-
250
-
251
-
252
-
253
-
254
-
255
-
256
-
257
-
258
-
259
-
260
-
261
-
262
-
263
-
264
-
265
-
266
-
267
-
268
-
269
-
270
-
271
-
272
-
273
-
274
-
275
-
276
-
277
-
278
-
279
-
280
-
281
-
282
-
283
-
284
-
285
-
286
-
287
-
288
-
289
-
290
-
291
-
292
-
293
-
294
-
295
-
296
-
297
-
298
-
299
-
300
-
301
-
302
-
303
-
304
-
305
-
306
-
307
-
308
-
309
-
310
-
311
-
312
-
313
-
314
-
315
-
316
-
317
-
318
-
319
-
320
-
321
-
322
-
323
-
324
-
325
-
326
-
327
-
328
-
329
-
330
-
331
-
332
-
333
-
334
-
335
-
336
-
337
-
338
-
339
-
340
-
341
-
342
-
343
-
344
-
345
-
346
-
347
-
348
-
349
-
350
-
351
-
352
-
353
-
354
-
355
-
356
-
357
-
358
-
359
-
360
-
361
-
362
-
363
-
364
-
365
-
366
-
367
-
368
-
369
-
370
-
371
-
372
-
373
-
374
-
375
-
376
-
377
-
378
-
379
-
380
-
381
-
382
-
383
-
384
-
385
-
386
-
387
-
388
-
389
-
390
-
391
-
392
-
393
-
394
-
395
-
396
-
397
-
398
-
399
-
400
-
401
-
402
-
403
-
404
-
405
-
406
-
407
-
408
-
409
-
410
-
411
-
412
-
413
-
414
-
415
-
416
-
417
-
418
-
419
-
420
-
421
-
422
-
423
-
424
-
425
-
426
-
427
-
428
-
429
-
430
-
431
-
432
-
433
-
434
-
435
-
436
-
437
-
438
-
439
-
440
-
441
-
442
-
443
-
444
-
445
 |
 |

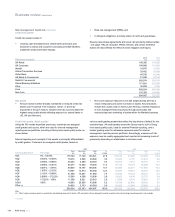
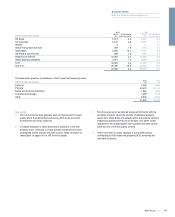
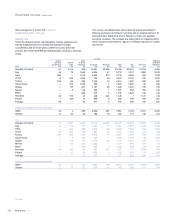
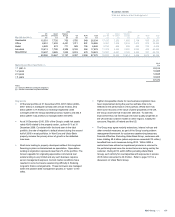
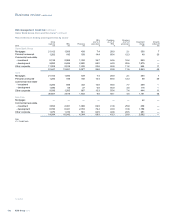
Key points
xExposure reductions occurred across most industry sectors and
geographic regions.
xModest growth in North America is attributable to the weakening of
sterling against the US dollar during the period and higher short-
term exposures to central banks.
xAt 9.6% of total exposure, the banks sector is one of the largest in
the Group, although it is geographically diversified with activities
conducted in the Group's key markets across the world. Exposure is
predominantly to major global banks (23% of sector exposure),
defined as those with diversified domestic and international activities.
The product range is diverse and includes loans and advances,
treasury and capital markets products. Overall there has been a
gradual downward trend in exposures to banks, but exposures have
fluctuated markedly due to lines being drawn and repaid over short
periods and mark to market movements associated with trading
activity. Overall asset quality has stabilised in line with improving
economic conditions, although the sovereign crisis affecting several
eurozone countries has placed downward pressure on the asset
quality of banks in these countries (11% of sector exposure).
xExposures to the non bank financial sector are dominated by traded
products and spread across a wide range of financial institutions
including insurance companies, securitisations, financial
intermediaries, finance companies, unleveraged and leveraged
funds (including hedge funds). The majority of these are domiciled in
the UK, Western Europe and US with no other material geographic
or sector concentrations and business is developed selectively.
Asset quality has stabilised as the economic environment has
improved. Exposures to defaulted entities totalled £1.8 billion, 3% of
total exposure to this sector.
xSovereigns comprise activities with central governments, central
banks and sub sovereigns such as local authorities in the Group's
key markets in the UK, Western Europe and USA. The Group’s
exposure to sovereigns fluctuates according to the Group's liquidity
requirements and cash positions which determine the level of cash
placed with sovereign entities. The asset quality of the portfolios has
been impacted by the sovereign crisis in several eurozone countries
and the resultant multiple downgrading of these countries.
xThe Group’s exposure to the property sector totals £114 billion, a
reduction of 11% in the period, of which 76% is commercial real
estate (further detail on pages 156 and 157). The remainder
comprises lending to property-related sectors including housing
associations, estate agents and management companies. The
majority of property (with the exception of Non-Core) is within the
UK Corporate division (33%) and Ulster Bank (6%).
xExposure to the manufacturing sector is concentrated in the
industrial (40%), agriculture (24%) and food & consumer (21%) sub-
sectors. The overall reduction in exposure of £10.9 billion is partly
due to the run-off and restructuring of assets in Western Europe and
in the Non-Core portfolio. Portfolio asset quality has held up well
during the year but fluctuating commodity prices continue to pose a
key risk to the more cyclical sub-sectors. Manufacturing exposure in
default totals £1.5 billion (2009 - £3.7 billion).
xThe transport sector accounts for 6% of exposure and primarily
comprises loans and advances to borrowers in the shipping,
automotive and aviation segments in the Core bank. Aviation Capital
and a portfolio of shipping loans are held within Non-Core. Core
bank exposure resides primarily in Corporate Banking and Global
Banking & Markets and the portfolio is well diversified
geographically. In aggregate, the exposure within and asset quality
of the Core portfolio remained stable over the year. Global economic
conditions and related trends in trade flows and discretionary
consumer spending continue to inform the Group’s cautious stance.
Transport exposure in default totals of £1.7 billion (2009 - £1 billion).
xWhilst there have been no material impairment charges for shipping
to date, the exposure that is subject to a heightened level of
monitoring currently stands at approximately £2.8 billion out of a
total portfolio of £13 billion, which reflects the continued difficult
market conditions that have been experienced during 2010. Recent
quarterly vessel valuations undertaken by external shipbrokers show
that the majority of our exposures remain fully secured. Conditions
will remain challenging for the foreseeable future.
155RBS Group 2010
Business review
Risk and balance sheet management