RBS 2010 Annual Report Download - page 357
Download and view the complete annual report
Please find page 357 of the 2010 RBS annual report below. You can navigate through the pages in the report by either clicking on the pages listed below, or by using the keyword search tool below to find specific information within the annual report.-
 1
1 -
2
-
3
-
4
-
5
-
6
-
7
-
8
-
9
-
10
-
11
-
12
-
13
-
14
-
15
-
16
-
17
-
18
-
19
-
20
-
21
-
22
-
23
-
24
-
25
-
26
-
27
-
28
-
29
-
30
-
31
-
32
-
33
-
34
-
35
-
36
-
37
-
38
-
39
-
40
-
41
-
42
-
43
-
44
-
45
-
46
-
47
-
48
-
49
-
50
-
51
-
52
-
53
-
54
-
55
-
56
-
57
-
58
-
59
-
60
-
61
-
62
-
63
-
64
-
65
-
66
-
67
-
68
-
69
-
70
-
71
-
72
-
73
-
74
-
75
-
76
-
77
-
78
-
79
-
80
-
81
-
82
-
83
-
84
-
85
-
86
-
87
-
88
-
89
-
90
-
91
-
92
-
93
-
94
-
95
-
96
-
97
-
98
-
99
-
100
-
101
-
102
-
103
-
104
-
105
-
106
-
107
-
108
-
109
-
110
-
111
-
112
-
113
-
114
-
115
-
116
-
117
-
118
-
119
-
120
-
121
-
122
-
123
-
124
-
125
-
126
-
127
-
128
-
129
-
130
-
131
-
132
-
133
-
134
-
135
-
136
-
137
-
138
-
139
-
140
-
141
-
142
-
143
-
144
-
145
-
146
-
147
-
148
-
149
-
150
-
151
-
152
-
153
-
154
-
155
-
156
-
157
-
158
-
159
-
160
-
161
-
162
-
163
-
164
-
165
-
166
-
167
-
168
-
169
-
170
-
171
-
172
-
173
-
174
-
175
-
176
-
177
-
178
-
179
-
180
-
181
-
182
-
183
-
184
-
185
-
186
-
187
-
188
-
189
-
190
-
191
-
192
-
193
-
194
-
195
-
196
-
197
-
198
-
199
-
200
-
201
-
202
-
203
-
204
-
205
-
206
-
207
-
208
-
209
-
210
-
211
-
212
-
213
-
214
-
215
-
216
-
217
-
218
-
219
-
220
-
221
-
222
-
223
-
224
-
225
-
226
-
227
-
228
-
229
-
230
-
231
-
232
-
233
-
234
-
235
-
236
-
237
-
238
-
239
-
240
-
241
-
242
-
243
-
244
-
245
-
246
-
247
-
248
-
249
-
250
-
251
-
252
-
253
-
254
-
255
-
256
-
257
-
258
-
259
-
260
-
261
-
262
-
263
-
264
-
265
-
266
-
267
-
268
-
269
-
270
-
271
-
272
-
273
-
274
-
275
-
276
-
277
-
278
-
279
-
280
-
281
-
282
-
283
-
284
-
285
-
286
-
287
-
288
-
289
-
290
-
291
-
292
-
293
-
294
-
295
-
296
-
297
-
298
-
299
-
300
-
301
-
302
-
303
-
304
-
305
-
306
-
307
-
308
-
309
-
310
-
311
-
312
-
313
-
314
-
315
-
316
-
317
-
318
-
319
-
320
-
321
-
322
-
323
-
324
-
325
-
326
-
327
-
328
-
329
-
330
-
331
-
332
-
333
-
334
-
335
-
336
-
337
-
338
-
339
-
340
-
341
-
342
-
343
-
344
-
345
-
346
-
 347
347 -
 348
348 -
 349
349 -
 350
350 -
 351
351 -
 352
352 -
 353
353 -
 354
354 -
 355
355 -
 356
356 -
 357
357 -
 358
358 -
 359
359 -
 360
360 -
 361
361 -
 362
362 -
 363
363 -
 364
364 -
 365
365 -
 366
366 -
 367
367 -
368
-
369
-
370
-
371
-
372
-
373
-
374
-
375
-
376
-
377
-
378
-
379
-
380
-
381
-
382
-
383
-
384
-
385
-
386
-
387
-
388
-
389
-
390
-
391
-
392
-
393
-
394
-
395
-
396
-
397
-
398
-
399
-
400
-
401
-
402
-
403
-
404
-
405
-
406
-
407
-
408
-
409
-
410
-
411
-
412
-
413
-
414
-
415
-
416
-
417
-
418
-
419
-
420
-
421
-
422
-
423
-
424
-
425
-
426
-
427
-
428
-
429
-
430
-
431
-
432
-
433
-
434
-
435
-
436
-
437
-
438
-
439
-
440
-
441
-
442
-
443
-
444
-
445
 |
 |

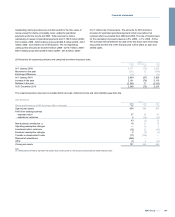
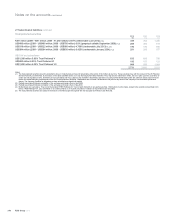
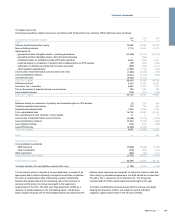
2010 2009 2008
£m £m £m
First Active plc
£20 million 11.75% perpetual tier two capital 26 26 26
€38 million 11.375% perpetual tier two capital 50 51 52
£1.3 million floating rate perpetual tier two capital 222
RBS NV and subsidiaries
€1,000 million 4.310% perpetual Bermudan callable subordinated tier 1 notes (callable March 2016) (10) —834 824
€800 million 10.00% fixed perpetual mandatory convertible tier 1 notes 2099 (10) —716 —
€967 million 10.00% fixed perpetual mandatory convertible tier 1 notes 2072 (10) —866 —
€833 million 10.00% fixed perpetual mandatory convertible tier 1 notes 2073 (10) —746 —
2,552 8,164 11,697
Notes:
(1) Partially repurchased following completion of the exchange and tender offers in April 2009.
(2) Partially repurchased following completion of the exchange and tender offers in May 2010.
(3) On-lent to The Royal Bank of Scotland plc on a subordinated basis.
(4) The company can satisfy interest payment obligations by issuing sufficient ordinary shares to appointed Trustees to enable them, on selling these shares, to settle the interest payment.
(5) Guaranteed by the company.
(6) Exchangeable at the option of the issuer into 8.392% (gross) non-cumulative preference shares of £1 each of National Westminster Bank Plc at any time.
(7) Except as stated above, claims in respect of the Group's undated loan capital are subordinated to the claims of other creditors. None of the Group's undated loan capital is secured.
(8) In the event of certain changes in tax laws, undated loan capital issues may be redeemed in whole, but not in part, at the option of the Group, at the principal amount thereof plus accrued interest,
subject to prior regulatory approval.
(9) Interest on all floating rate subordinated notes is calculated by reference to market rates.
(10) Transferred to the Dutch State on legal separation of ABN AMRO Holding N.V.
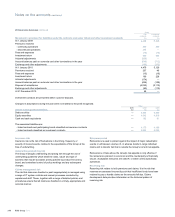
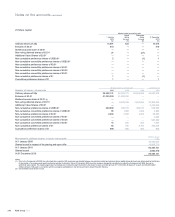
Preference shares
2010 2009 2008
£m £m £m
The company (1)
Non-cumulative preference shares of US$0.01
Series F US$156 million (2009 and 2008 - US$200 million) 7.65% (redeemable at option of issuer) (2) 101 123 137
Series H US$242 million (2009 and 2008 - US$300 million) 7.25% (redeemable at option of issuer) (2) 156 185 205
Series L US$751 million (2009 and 2008 - US$850 million) 5.75% (redeemable at option of issuer) (2) 484 524 582
Non-cumulative convertible preference shares of US$0.01
Series 1 US$65 million (2009 and 2008 - US$1,000 million) 9.118% (redeemable at option of issuer) (3) 43 630 698
Non-cumulative convertible preference shares of £0.01
Series 1 £15 million (2009 and 2008 - £200 million) 7.387% (redeemable at option of issuer) (3) 15 199 211
Cumulative preference shares of £1
£0.5 million 11% and £0.4 million 5.5% (non-redeemable) 111
800 1,662 1,834
National Westminster Bank Plc
Non-cumulative preference shares of £1
Series A £140 million 9% (non-redeemable) 144 145 145
Non-cumulative preference shares of US$25
Series C US$246 million (2009 and 2008 - US$300 million) 7.7628% (2,4) 168 193 215
1,112 2,000 2,194
Notes:
(1) Further details of the contractual terms of the preference shares are given in Note 29.
(2) Partially repurchased following completion of the exchange and tender offers in May 2010.
(3) Partially converted into ordinary shares in the company in 2010 (see Note 29).
(4) Series C preference shares each carry a gross dividend of 8.625% inclusive of associated tax credit. Redeemable at the option of the issuer at par.
355RBS Group 2010
Financial statements