RBS 2010 Annual Report Download - page 225
Download and view the complete annual report
Please find page 225 of the 2010 RBS annual report below. You can navigate through the pages in the report by either clicking on the pages listed below, or by using the keyword search tool below to find specific information within the annual report.-
 1
1 -
2
-
3
-
4
-
5
-
6
-
7
-
8
-
9
-
10
-
11
-
12
-
13
-
14
-
15
-
16
-
17
-
18
-
19
-
20
-
21
-
22
-
23
-
24
-
25
-
26
-
27
-
28
-
29
-
30
-
31
-
32
-
33
-
34
-
35
-
36
-
37
-
38
-
39
-
40
-
41
-
42
-
43
-
44
-
45
-
46
-
47
-
48
-
49
-
50
-
51
-
52
-
53
-
54
-
55
-
56
-
57
-
58
-
59
-
60
-
61
-
62
-
63
-
64
-
65
-
66
-
67
-
68
-
69
-
70
-
71
-
72
-
73
-
74
-
75
-
76
-
77
-
78
-
79
-
80
-
81
-
82
-
83
-
84
-
85
-
86
-
87
-
88
-
89
-
90
-
91
-
92
-
93
-
94
-
95
-
96
-
97
-
98
-
99
-
100
-
101
-
102
-
103
-
104
-
105
-
106
-
107
-
108
-
109
-
110
-
111
-
112
-
113
-
114
-
115
-
116
-
117
-
118
-
119
-
120
-
121
-
122
-
123
-
124
-
125
-
126
-
127
-
128
-
129
-
130
-
131
-
132
-
133
-
134
-
135
-
136
-
137
-
138
-
139
-
140
-
141
-
142
-
143
-
144
-
145
-
146
-
147
-
148
-
149
-
150
-
151
-
152
-
153
-
154
-
155
-
156
-
157
-
158
-
159
-
160
-
161
-
162
-
163
-
164
-
165
-
166
-
167
-
168
-
169
-
170
-
171
-
172
-
173
-
174
-
175
-
176
-
177
-
178
-
179
-
180
-
181
-
182
-
183
-
184
-
185
-
186
-
187
-
188
-
189
-
190
-
191
-
192
-
193
-
194
-
195
-
196
-
197
-
198
-
199
-
200
-
201
-
202
-
203
-
204
-
205
-
206
-
207
-
208
-
209
-
210
-
211
-
212
-
213
-
214
-
 215
215 -
 216
216 -
 217
217 -
 218
218 -
 219
219 -
 220
220 -
 221
221 -
 222
222 -
 223
223 -
 224
224 -
 225
225 -
 226
226 -
 227
227 -
 228
228 -
 229
229 -
 230
230 -
 231
231 -
 232
232 -
 233
233 -
 234
234 -
 235
235 -
236
-
237
-
238
-
239
-
240
-
241
-
242
-
243
-
244
-
245
-
246
-
247
-
248
-
249
-
250
-
251
-
252
-
253
-
254
-
255
-
256
-
257
-
258
-
259
-
260
-
261
-
262
-
263
-
264
-
265
-
266
-
267
-
268
-
269
-
270
-
271
-
272
-
273
-
274
-
275
-
276
-
277
-
278
-
279
-
280
-
281
-
282
-
283
-
284
-
285
-
286
-
287
-
288
-
289
-
290
-
291
-
292
-
293
-
294
-
295
-
296
-
297
-
298
-
299
-
300
-
301
-
302
-
303
-
304
-
305
-
306
-
307
-
308
-
309
-
310
-
311
-
312
-
313
-
314
-
315
-
316
-
317
-
318
-
319
-
320
-
321
-
322
-
323
-
324
-
325
-
326
-
327
-
328
-
329
-
330
-
331
-
332
-
333
-
334
-
335
-
336
-
337
-
338
-
339
-
340
-
341
-
342
-
343
-
344
-
345
-
346
-
347
-
348
-
349
-
350
-
351
-
352
-
353
-
354
-
355
-
356
-
357
-
358
-
359
-
360
-
361
-
362
-
363
-
364
-
365
-
366
-
367
-
368
-
369
-
370
-
371
-
372
-
373
-
374
-
375
-
376
-
377
-
378
-
379
-
380
-
381
-
382
-
383
-
384
-
385
-
386
-
387
-
388
-
389
-
390
-
391
-
392
-
393
-
394
-
395
-
396
-
397
-
398
-
399
-
400
-
401
-
402
-
403
-
404
-
405
-
406
-
407
-
408
-
409
-
410
-
411
-
412
-
413
-
414
-
415
-
416
-
417
-
418
-
419
-
420
-
421
-
422
-
423
-
424
-
425
-
426
-
427
-
428
-
429
-
430
-
431
-
432
-
433
-
434
-
435
-
436
-
437
-
438
-
439
-
440
-
441
-
442
-
443
-
444
-
445
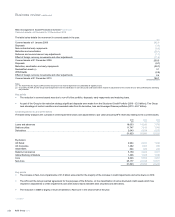
 |
 |

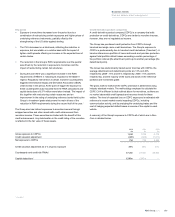
First loss utilisation
The triggered amount is equivalent to the aggregate outstanding principal
amount on the trigger date excluding interest, fees, premium or any other
non-principal sum that is accrued or payable, except where it was
capitalised on or before 31 December 2008. At the trigger date, in
economic terms, there is an exchange of assets, with the Group receiving
atwo year interest-bearing government receivable in exchange for the
asset.
APS recoveries include any return of value on a triggered asset, although
these are only recognised for the Scheme reporting purposes when they
are realised in cash. The net triggered amount at any point in time only
takes into account cash recoveries to date. As with any bespoke and
highly complex legal agreement there are various areas of interpretation,
some of which could have a material impact on the net triggered amount
identified to date.
The Scheme rules are designed to allow for data correction over the life
of the Scheme.
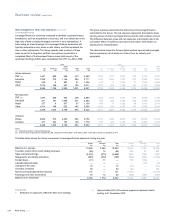
The table below summarises the triggered amount and related cash
recoveries by division.
2010 2009
Triggered
amount
Cash
recoveries
to date
Net
triggered
amount
Triggered
amount
Cash
recoveries
to date
Net
triggered
amount
£m £m £m £m £m £m
UK Retail 3,675 455 3,220 3,340 129 3,211
UK Corporate 4,640 1,115 3,525 3,570 604 2,966
Ulster Bank 1,500 160 1,340 704 47 657
Retail & Commercial 9,815 1,730 8,085 7,614 780 6,834
Global Banking & Markets 2,547 749 1,798 1,748 108 1,640
Core 12,362 2,479 9,883 9,362 888 8,474
Non-Core 32,138 4,544 27,594 18,905 777 18,128
44,500 7,023 37,477 28,267 1,665 26,602
Loss credits 1,241 —
38,718 26,602
Notes:
(1) The triggered amount on a covered asset is calculated when an asset is triggered (due to bankruptcy, failure to pay after a grace period or restructuring with an impairment) and is the lower of the
covered amount and the outstanding amount for each covered asset. The Group expects additional assets to trigger upon expiry of relevant grace periods based on the current risk rating and level of
impairments on covered assets.
(2) Following the reclassification of some structured credit assets from derivatives to debt securities, the APA and the Group also reached agreement on an additional implied write down trigger in
respect of these assets. This occurs if (a) on two successive relevant payment dates, the covered asset has a rating of Caa2 or below by Moody’s, CCC or below by Standard & Poor’s or Fitch or a
comparable rating from an internationally recognised credit rating agency and/or (b) on any two successive relevant payment dates, the mark-to-market value of the covered asset is equal to or less
than 40 per cent of the par value of the covered asset, in each case as at such relevant payment date.
(3) Under the Scheme rules, the Group may apply to the APA for loss credits in respect of the disposal of non-triggered assets. A loss credit counts towards the first loss threshold and is typically
determined by the APA based on the expected loss of the relevant asset.
(4) The Group and the APA remain in discussion with regard to loss credits in relation to the withdrawal of £2.0 billion of derivative assets during Q2 2010 and the disposal of approximately £1.6 billion of
structured finance and leveraged finance assets in 2010.
(5) The Scheme rules contain provision for on-going revision of data.
Key points
xThe Group received loss credits in relation to some of the withdrawals and disposals of £1.2 billion in 2010.
xThe Group currently expects recoveries on triggered amounts to be approximately 45% over the life of the relevant assets. On this basis, the
expected loss on triggered assets at 31 December 2010 is approximately £25 billion (42%) of the £60 billion first loss threshold under APS.
223RBS Group 2010
Business review
Risk and balance sheet management