RBS 2010 Annual Report Download - page 221
Download and view the complete annual report
Please find page 221 of the 2010 RBS annual report below. You can navigate through the pages in the report by either clicking on the pages listed below, or by using the keyword search tool below to find specific information within the annual report.-
 1
1 -
2
-
3
-
4
-
5
-
6
-
7
-
8
-
9
-
10
-
11
-
12
-
13
-
14
-
15
-
16
-
17
-
18
-
19
-
20
-
21
-
22
-
23
-
24
-
25
-
26
-
27
-
28
-
29
-
30
-
31
-
32
-
33
-
34
-
35
-
36
-
37
-
38
-
39
-
40
-
41
-
42
-
43
-
44
-
45
-
46
-
47
-
48
-
49
-
50
-
51
-
52
-
53
-
54
-
55
-
56
-
57
-
58
-
59
-
60
-
61
-
62
-
63
-
64
-
65
-
66
-
67
-
68
-
69
-
70
-
71
-
72
-
73
-
74
-
75
-
76
-
77
-
78
-
79
-
80
-
81
-
82
-
83
-
84
-
85
-
86
-
87
-
88
-
89
-
90
-
91
-
92
-
93
-
94
-
95
-
96
-
97
-
98
-
99
-
100
-
101
-
102
-
103
-
104
-
105
-
106
-
107
-
108
-
109
-
110
-
111
-
112
-
113
-
114
-
115
-
116
-
117
-
118
-
119
-
120
-
121
-
122
-
123
-
124
-
125
-
126
-
127
-
128
-
129
-
130
-
131
-
132
-
133
-
134
-
135
-
136
-
137
-
138
-
139
-
140
-
141
-
142
-
143
-
144
-
145
-
146
-
147
-
148
-
149
-
150
-
151
-
152
-
153
-
154
-
155
-
156
-
157
-
158
-
159
-
160
-
161
-
162
-
163
-
164
-
165
-
166
-
167
-
168
-
169
-
170
-
171
-
172
-
173
-
174
-
175
-
176
-
177
-
178
-
179
-
180
-
181
-
182
-
183
-
184
-
185
-
186
-
187
-
188
-
189
-
190
-
191
-
192
-
193
-
194
-
195
-
196
-
197
-
198
-
199
-
200
-
201
-
202
-
203
-
204
-
205
-
206
-
207
-
208
-
209
-
210
-
 211
211 -
 212
212 -
 213
213 -
 214
214 -
 215
215 -
 216
216 -
 217
217 -
 218
218 -
 219
219 -
 220
220 -
 221
221 -
 222
222 -
 223
223 -
 224
224 -
 225
225 -
 226
226 -
 227
227 -
 228
228 -
 229
229 -
 230
230 -
 231
231 -
232
-
233
-
234
-
235
-
236
-
237
-
238
-
239
-
240
-
241
-
242
-
243
-
244
-
245
-
246
-
247
-
248
-
249
-
250
-
251
-
252
-
253
-
254
-
255
-
256
-
257
-
258
-
259
-
260
-
261
-
262
-
263
-
264
-
265
-
266
-
267
-
268
-
269
-
270
-
271
-
272
-
273
-
274
-
275
-
276
-
277
-
278
-
279
-
280
-
281
-
282
-
283
-
284
-
285
-
286
-
287
-
288
-
289
-
290
-
291
-
292
-
293
-
294
-
295
-
296
-
297
-
298
-
299
-
300
-
301
-
302
-
303
-
304
-
305
-
306
-
307
-
308
-
309
-
310
-
311
-
312
-
313
-
314
-
315
-
316
-
317
-
318
-
319
-
320
-
321
-
322
-
323
-
324
-
325
-
326
-
327
-
328
-
329
-
330
-
331
-
332
-
333
-
334
-
335
-
336
-
337
-
338
-
339
-
340
-
341
-
342
-
343
-
344
-
345
-
346
-
347
-
348
-
349
-
350
-
351
-
352
-
353
-
354
-
355
-
356
-
357
-
358
-
359
-
360
-
361
-
362
-
363
-
364
-
365
-
366
-
367
-
368
-
369
-
370
-
371
-
372
-
373
-
374
-
375
-
376
-
377
-
378
-
379
-
380
-
381
-
382
-
383
-
384
-
385
-
386
-
387
-
388
-
389
-
390
-
391
-
392
-
393
-
394
-
395
-
396
-
397
-
398
-
399
-
400
-
401
-
402
-
403
-
404
-
405
-
406
-
407
-
408
-
409
-
410
-
411
-
412
-
413
-
414
-
415
-
416
-
417
-
418
-
419
-
420
-
421
-
422
-
423
-
424
-
425
-
426
-
427
-
428
-
429
-
430
-
431
-
432
-
433
-
434
-
435
-
436
-
437
-
438
-
439
-
440
-
441
-
442
-
443
-
444
-
445
 |
 |

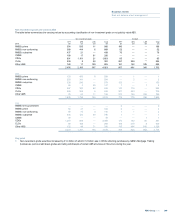
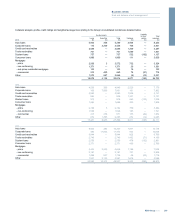
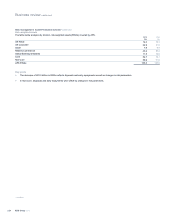
Collateral analysis, profile, credit ratings and weighted average lives relating to the Group’s consolidated conduits are detailed below.
Funded assets
Loans Securities Total Undrawn
Liquidity
for third
parties
Total
exposure
2010 £m £m £m £m £m £m
Auto loans 4,943 346 5,289 2,964 — 8,253
Corporate loans 115 2,340 2,455 106 — 2,561
Credit card receivables 2,088 — 2,088 1,209 — 3,297
Trade receivables 761 — 761 1,090 — 1,851
Student loans 757 — 757 532 (132) 1,157
Consumer loans 1,889 — 1,889 111 — 2,000
Mortgages
- prime 2,569 3 2,572 752 — 3,324
- non-conforming 1,371 — 1,371 20 — 1,391
- sub-prime residential mortgages 103 — 103 19 — 122
- commercial 210 450 660 76 (21) 715
Other 1,072 997 2,069 (8) (10) 2,051
15,878 4,136 20,014 6,871 (163) 26,722
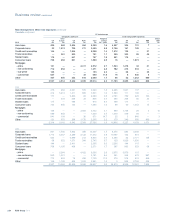
2009
Auto loans 4,293 356 4,649 2,526 — 7,175
Corporate loans 106 7,695 7,801 161 — 7,962
Credit card receivables 4,083 — 4,083 1,058 — 5,141
Trade receivables 806 — 806 1,351 — 2,157
Student loans 915 — 915 263 (132) 1,046
Consumer loans 1,686 — 1,686 222 — 1,908
Mortgages
- prime 2,739 3 2,742 750 — 3,492
- non-conforming 1,548 — 1,548 193 — 1,741
- commercial 413 458 871 155 (22) 1,004
Other 872 1,393 2,265 232 (12) 2,485
17,461 9,905 27,366 6,911 (166) 34,111
2008
Auto loans 9,924 383 10,307 1,871 — 12,178
Corporate loans 430 11,042 11,472 534 — 12,006
Credit card receivables 5,844 — 5,844 922 — 6,766
Trade receivables 2,745 — 2,745 1,432 (71) 4,106
Student loans 2,555 — 2,555 478 (132) 2,901
Consumer loans 2,371 — 2,371 409 — 2,780
Mortgages
- prime 4,416 2,250 6,666 1,188 — 7,854
- non-conforming 2,181 — 2,181 727 — 2,908
- commercial 1,228 507 1,735 66 (23) 1,778
Other 1,851 2,130 3,981 1,615 — 5,596
33,545 16,312 49,857 9,242 (226) 58,873
219RBS Group 2010
Business review
Risk and balance sheet management