RBS 2010 Annual Report Download - page 164
Download and view the complete annual report
Please find page 164 of the 2010 RBS annual report below. You can navigate through the pages in the report by either clicking on the pages listed below, or by using the keyword search tool below to find specific information within the annual report.-
 1
1 -
2
-
3
-
4
-
5
-
6
-
7
-
8
-
9
-
10
-
11
-
12
-
13
-
14
-
15
-
16
-
17
-
18
-
19
-
20
-
21
-
22
-
23
-
24
-
25
-
26
-
27
-
28
-
29
-
30
-
31
-
32
-
33
-
34
-
35
-
36
-
37
-
38
-
39
-
40
-
41
-
42
-
43
-
44
-
45
-
46
-
47
-
48
-
49
-
50
-
51
-
52
-
53
-
54
-
55
-
56
-
57
-
58
-
59
-
60
-
61
-
62
-
63
-
64
-
65
-
66
-
67
-
68
-
69
-
70
-
71
-
72
-
73
-
74
-
75
-
76
-
77
-
78
-
79
-
80
-
81
-
82
-
83
-
84
-
85
-
86
-
87
-
88
-
89
-
90
-
91
-
92
-
93
-
94
-
95
-
96
-
97
-
98
-
99
-
100
-
101
-
102
-
103
-
104
-
105
-
106
-
107
-
108
-
109
-
110
-
111
-
112
-
113
-
114
-
115
-
116
-
117
-
118
-
119
-
120
-
121
-
122
-
123
-
124
-
125
-
126
-
127
-
128
-
129
-
130
-
131
-
132
-
133
-
134
-
135
-
136
-
137
-
138
-
139
-
140
-
141
-
142
-
143
-
144
-
145
-
146
-
147
-
148
-
149
-
150
-
151
-
152
-
153
-
 154
154 -
 155
155 -
 156
156 -
 157
157 -
 158
158 -
 159
159 -
 160
160 -
 161
161 -
 162
162 -
 163
163 -
 164
164 -
 165
165 -
 166
166 -
 167
167 -
 168
168 -
 169
169 -
 170
170 -
 171
171 -
 172
172 -
 173
173 -
 174
174 -
175
-
176
-
177
-
178
-
179
-
180
-
181
-
182
-
183
-
184
-
185
-
186
-
187
-
188
-
189
-
190
-
191
-
192
-
193
-
194
-
195
-
196
-
197
-
198
-
199
-
200
-
201
-
202
-
203
-
204
-
205
-
206
-
207
-
208
-
209
-
210
-
211
-
212
-
213
-
214
-
215
-
216
-
217
-
218
-
219
-
220
-
221
-
222
-
223
-
224
-
225
-
226
-
227
-
228
-
229
-
230
-
231
-
232
-
233
-
234
-
235
-
236
-
237
-
238
-
239
-
240
-
241
-
242
-
243
-
244
-
245
-
246
-
247
-
248
-
249
-
250
-
251
-
252
-
253
-
254
-
255
-
256
-
257
-
258
-
259
-
260
-
261
-
262
-
263
-
264
-
265
-
266
-
267
-
268
-
269
-
270
-
271
-
272
-
273
-
274
-
275
-
276
-
277
-
278
-
279
-
280
-
281
-
282
-
283
-
284
-
285
-
286
-
287
-
288
-
289
-
290
-
291
-
292
-
293
-
294
-
295
-
296
-
297
-
298
-
299
-
300
-
301
-
302
-
303
-
304
-
305
-
306
-
307
-
308
-
309
-
310
-
311
-
312
-
313
-
314
-
315
-
316
-
317
-
318
-
319
-
320
-
321
-
322
-
323
-
324
-
325
-
326
-
327
-
328
-
329
-
330
-
331
-
332
-
333
-
334
-
335
-
336
-
337
-
338
-
339
-
340
-
341
-
342
-
343
-
344
-
345
-
346
-
347
-
348
-
349
-
350
-
351
-
352
-
353
-
354
-
355
-
356
-
357
-
358
-
359
-
360
-
361
-
362
-
363
-
364
-
365
-
366
-
367
-
368
-
369
-
370
-
371
-
372
-
373
-
374
-
375
-
376
-
377
-
378
-
379
-
380
-
381
-
382
-
383
-
384
-
385
-
386
-
387
-
388
-
389
-
390
-
391
-
392
-
393
-
394
-
395
-
396
-
397
-
398
-
399
-
400
-
401
-
402
-
403
-
404
-
405
-
406
-
407
-
408
-
409
-
410
-
411
-
412
-
413
-
414
-
415
-
416
-
417
-
418
-
419
-
420
-
421
-
422
-
423
-
424
-
425
-
426
-
427
-
428
-
429
-
430
-
431
-
432
-
433
-
434
-
435
-
436
-
437
-
438
-
439
-
440
-
441
-
442
-
443
-
444
-
445
 |
 |

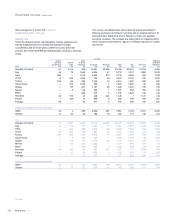
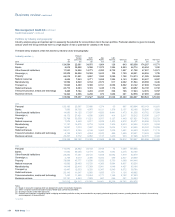
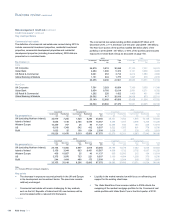
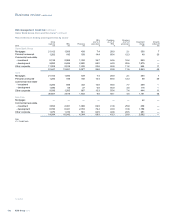
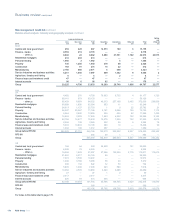
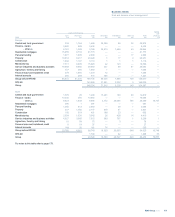
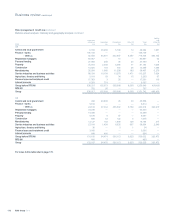
Risk management: Credit risk continued
Ulster Bank Group (Core and Non-Core)* continued
Risk elements in lending and impairments by sector
Gross
loans (1) REIL Provisions
REIL
as a % of
gross loans
Provisions
as a % of
REIL
Provisions
as a % of
gross loans
Impairment
charge
Amounts
written-off
2010 £m £m £m % % % £m £m
Ulster Bank Group
Mortgages 21,162 1,566 439 7.4 28.0 2.1 336 7
Personal unsecured 1,282 185 158 14.4 85.4 12.3 48 30
Commercial real estate
- investment 8,138 2,989 1,332 36.7 44.6 16.4 889 —
- development 9,850 6,406 2,820 65.0 44.0 28.6 1,875 —
Other corporate 11,009 2,515 1,228 22.8 48.8 11.2 695 11
51,441 13,661 5,977 26.6 43.8 11.6 3,843 48
Core
Mortgages 21,162 1,566 439 7.4 28.0 2.1 294 7
Personal unsecured 1,282 185 158 14.4 85.4 12.3 48 30
Commercial real estate
- investment 4,284 598 332 14.0 55.5 7.7 259 —
- development 1,090 65 37 6.0 56.9 3.4 116 —
Other corporate 9,039 1,205 667 13.3 55.4 7.4 444 11
36,857 3,619 1,633 9.8 45.1 4.4 1,161 48
Non-Core
Mortgages — — — — — — 42 —
Commercial real estate
- investment 3,854 2,391 1,000 62.0 41.8 25.9 630 —
- development 8,760 6,341 2,783 72.4 43.9 31.8 1,759 —
Other corporate 1,970 1,310 561 66.5 42.8 28.5 251 —
14,584 10,042 4,344 68.9 43.3 29.8 2,682 —
Note:
(1) Funded loans.
*unaudited
RBS Group 2010162
Business review continued