RBS 2010 Annual Report Download - page 176
Download and view the complete annual report
Please find page 176 of the 2010 RBS annual report below. You can navigate through the pages in the report by either clicking on the pages listed below, or by using the keyword search tool below to find specific information within the annual report.-
 1
1 -
2
-
3
-
4
-
5
-
6
-
7
-
8
-
9
-
10
-
11
-
12
-
13
-
14
-
15
-
16
-
17
-
18
-
19
-
20
-
21
-
22
-
23
-
24
-
25
-
26
-
27
-
28
-
29
-
30
-
31
-
32
-
33
-
34
-
35
-
36
-
37
-
38
-
39
-
40
-
41
-
42
-
43
-
44
-
45
-
46
-
47
-
48
-
49
-
50
-
51
-
52
-
53
-
54
-
55
-
56
-
57
-
58
-
59
-
60
-
61
-
62
-
63
-
64
-
65
-
66
-
67
-
68
-
69
-
70
-
71
-
72
-
73
-
74
-
75
-
76
-
77
-
78
-
79
-
80
-
81
-
82
-
83
-
84
-
85
-
86
-
87
-
88
-
89
-
90
-
91
-
92
-
93
-
94
-
95
-
96
-
97
-
98
-
99
-
100
-
101
-
102
-
103
-
104
-
105
-
106
-
107
-
108
-
109
-
110
-
111
-
112
-
113
-
114
-
115
-
116
-
117
-
118
-
119
-
120
-
121
-
122
-
123
-
124
-
125
-
126
-
127
-
128
-
129
-
130
-
131
-
132
-
133
-
134
-
135
-
136
-
137
-
138
-
139
-
140
-
141
-
142
-
143
-
144
-
145
-
146
-
147
-
148
-
149
-
150
-
151
-
152
-
153
-
154
-
155
-
156
-
157
-
158
-
159
-
160
-
161
-
162
-
163
-
164
-
165
-
 166
166 -
 167
167 -
 168
168 -
 169
169 -
 170
170 -
 171
171 -
 172
172 -
 173
173 -
 174
174 -
 175
175 -
 176
176 -
 177
177 -
 178
178 -
 179
179 -
 180
180 -
 181
181 -
 182
182 -
 183
183 -
 184
184 -
 185
185 -
 186
186 -
187
-
188
-
189
-
190
-
191
-
192
-
193
-
194
-
195
-
196
-
197
-
198
-
199
-
200
-
201
-
202
-
203
-
204
-
205
-
206
-
207
-
208
-
209
-
210
-
211
-
212
-
213
-
214
-
215
-
216
-
217
-
218
-
219
-
220
-
221
-
222
-
223
-
224
-
225
-
226
-
227
-
228
-
229
-
230
-
231
-
232
-
233
-
234
-
235
-
236
-
237
-
238
-
239
-
240
-
241
-
242
-
243
-
244
-
245
-
246
-
247
-
248
-
249
-
250
-
251
-
252
-
253
-
254
-
255
-
256
-
257
-
258
-
259
-
260
-
261
-
262
-
263
-
264
-
265
-
266
-
267
-
268
-
269
-
270
-
271
-
272
-
273
-
274
-
275
-
276
-
277
-
278
-
279
-
280
-
281
-
282
-
283
-
284
-
285
-
286
-
287
-
288
-
289
-
290
-
291
-
292
-
293
-
294
-
295
-
296
-
297
-
298
-
299
-
300
-
301
-
302
-
303
-
304
-
305
-
306
-
307
-
308
-
309
-
310
-
311
-
312
-
313
-
314
-
315
-
316
-
317
-
318
-
319
-
320
-
321
-
322
-
323
-
324
-
325
-
326
-
327
-
328
-
329
-
330
-
331
-
332
-
333
-
334
-
335
-
336
-
337
-
338
-
339
-
340
-
341
-
342
-
343
-
344
-
345
-
346
-
347
-
348
-
349
-
350
-
351
-
352
-
353
-
354
-
355
-
356
-
357
-
358
-
359
-
360
-
361
-
362
-
363
-
364
-
365
-
366
-
367
-
368
-
369
-
370
-
371
-
372
-
373
-
374
-
375
-
376
-
377
-
378
-
379
-
380
-
381
-
382
-
383
-
384
-
385
-
386
-
387
-
388
-
389
-
390
-
391
-
392
-
393
-
394
-
395
-
396
-
397
-
398
-
399
-
400
-
401
-
402
-
403
-
404
-
405
-
406
-
407
-
408
-
409
-
410
-
411
-
412
-
413
-
414
-
415
-
416
-
417
-
418
-
419
-
420
-
421
-
422
-
423
-
424
-
425
-
426
-
427
-
428
-
429
-
430
-
431
-
432
-
433
-
434
-
435
-
436
-
437
-
438
-
439
-
440
-
441
-
442
-
443
-
444
-
445
 |
 |

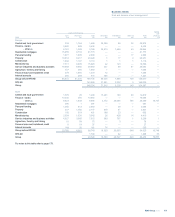
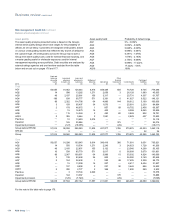
Risk management: Credit risk continued
Balance sheet analysis continued
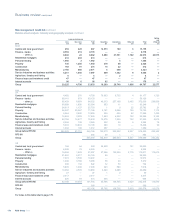
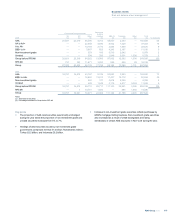
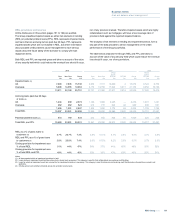
Asset quality
The asset qualityanalysis presented below is based on the Group’s
internal asset quality ratings which have ranges for the probability of
default, as set out below. Customers are assigned credit grades, based
on various credit grading models that reflect the key drivers of default for
the customer type. All credit grades across the Group map to both a
Group level asset quality scale, used for external financial reporting, and
amaster grading scale for wholesale exposures used for internal
management reporting across portfolios. Debt securities are analysed by
external ratings agencies and are therefore excluded from the table
below and are set out on pages 176 and 177.
Asset quality band Probability of default range
AQ1 0% - 0.034%
AQ2 0.034% - 0.048%
AQ3 0.048% - 0.095%
AQ4 0.095% - 0.381%
AQ5 0.381% - 1.076%
AQ6 1.076% - 2.153%
AQ7 2.153% - 6.089%
AQ8 6.089% - 17.222%
AQ9 17.222% - 100%
AQ10 100%
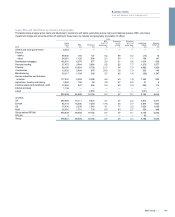
Cash and
balances
at central
banks
Loans and
advances
to banks (1)
Loans and
advances to
customers
Settlement
balances Derivatives
Other
financial
instruments Commitments
Contingent
liabilities Total
2010 £m £m £m £m £m £m £m £m £m
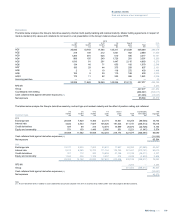
Total
AQ1 56,655 91,952 126,444 6,815 408,489 658 78,728 9,745 779,486
AQ2 14 598 13,282 1,271 2,659 3 26,128 1,980 45,935
AQ3 48 2,197 25,981 156 3,317 — 25,731 4,337 61,767
AQ4 188 639 95,777 571 3,391 6 41,027 6,522 148,121
AQ5 99 2,322 114,796 64 4,860 144 38,612 5,169 166,066
AQ6 3159 65,497 34 1,070 — 25,991 2,230 94,984
AQ7 2178 46,072 1 857 69 18,752 2,456 68,387
AQ8 —15 16,573 14 403 — 9,289 9,545 35,839
AQ9 — 115 14,263 2 450 80 3,889 932 19,731
AQ10 5 355 5,644 2 1,581 — 2,829 407 10,823
Past due —10 13,430 2,675 — —
— — 16,115
Impaired — 145 35,556 — —375 — — 36,076
Impairment provision —(127) (18,055) — —(29) — — (18,211)
Group before RFS MI 57,014 98,558 555,260 11,605 427,077 1,306 270,976 43,323 1,465,119
RFS MI — 2 — — — — — 32 34
Group 57,014 98,560 555,260 11,605 427,077 1,306 270,976 43,355 1,465,153
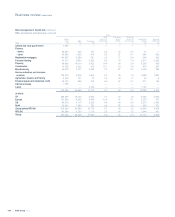
Core
AQ1 56,637 91,298 103,645 6,814 396,419 366 71,091 9,651 735,921
AQ2 14 550 10,534 1,271 2,243 3 24,923 1,728 41,266
AQ3 48 2,165 22,851 155 3,132 — 23,546 4,268 56,165
AQ4 10 539 85,779 571 3,017 6 36,909 5,070 131,901
AQ5 99 2,247 100,051 64 3,988 15 35,302 4,924 146,690
AQ6 3138 53,498 34 805 — 24,050 2,140 80,668
AQ7 2154 38,438 1 595 69 17,605 2,309 59,173
AQ8 —15 13,290 14 257 — 8,617 9,434 31,627
AQ9 —107 9,898 2 237 50 3,442 886 14,622
AQ10 5300 2,777 2 368 — 1,500 250 5,202
Past due — 3 10,744 2,629 — — — — 13,376
Impaired —144 13,367 — — 375 — — 13,886
Impairment provision —(126) (7,740) — — (29) — — (7,895)
Group before RFS MI 56,818 97,534 457,132 11,557 411,061 855 246,985 40,660 1,322,602
For the note to this table refer to page 176.
RBS Group 2010174
Business review continued