RBS 2010 Annual Report Download - page 160
Download and view the complete annual report
Please find page 160 of the 2010 RBS annual report below. You can navigate through the pages in the report by either clicking on the pages listed below, or by using the keyword search tool below to find specific information within the annual report.-
 1
1 -
2
-
3
-
4
-
5
-
6
-
7
-
8
-
9
-
10
-
11
-
12
-
13
-
14
-
15
-
16
-
17
-
18
-
19
-
20
-
21
-
22
-
23
-
24
-
25
-
26
-
27
-
28
-
29
-
30
-
31
-
32
-
33
-
34
-
35
-
36
-
37
-
38
-
39
-
40
-
41
-
42
-
43
-
44
-
45
-
46
-
47
-
48
-
49
-
50
-
51
-
52
-
53
-
54
-
55
-
56
-
57
-
58
-
59
-
60
-
61
-
62
-
63
-
64
-
65
-
66
-
67
-
68
-
69
-
70
-
71
-
72
-
73
-
74
-
75
-
76
-
77
-
78
-
79
-
80
-
81
-
82
-
83
-
84
-
85
-
86
-
87
-
88
-
89
-
90
-
91
-
92
-
93
-
94
-
95
-
96
-
97
-
98
-
99
-
100
-
101
-
102
-
103
-
104
-
105
-
106
-
107
-
108
-
109
-
110
-
111
-
112
-
113
-
114
-
115
-
116
-
117
-
118
-
119
-
120
-
121
-
122
-
123
-
124
-
125
-
126
-
127
-
128
-
129
-
130
-
131
-
132
-
133
-
134
-
135
-
136
-
137
-
138
-
139
-
140
-
141
-
142
-
143
-
144
-
145
-
146
-
147
-
148
-
149
-
 150
150 -
 151
151 -
 152
152 -
 153
153 -
 154
154 -
 155
155 -
 156
156 -
 157
157 -
 158
158 -
 159
159 -
 160
160 -
 161
161 -
 162
162 -
 163
163 -
 164
164 -
 165
165 -
 166
166 -
 167
167 -
 168
168 -
 169
169 -
 170
170 -
171
-
172
-
173
-
174
-
175
-
176
-
177
-
178
-
179
-
180
-
181
-
182
-
183
-
184
-
185
-
186
-
187
-
188
-
189
-
190
-
191
-
192
-
193
-
194
-
195
-
196
-
197
-
198
-
199
-
200
-
201
-
202
-
203
-
204
-
205
-
206
-
207
-
208
-
209
-
210
-
211
-
212
-
213
-
214
-
215
-
216
-
217
-
218
-
219
-
220
-
221
-
222
-
223
-
224
-
225
-
226
-
227
-
228
-
229
-
230
-
231
-
232
-
233
-
234
-
235
-
236
-
237
-
238
-
239
-
240
-
241
-
242
-
243
-
244
-
245
-
246
-
247
-
248
-
249
-
250
-
251
-
252
-
253
-
254
-
255
-
256
-
257
-
258
-
259
-
260
-
261
-
262
-
263
-
264
-
265
-
266
-
267
-
268
-
269
-
270
-
271
-
272
-
273
-
274
-
275
-
276
-
277
-
278
-
279
-
280
-
281
-
282
-
283
-
284
-
285
-
286
-
287
-
288
-
289
-
290
-
291
-
292
-
293
-
294
-
295
-
296
-
297
-
298
-
299
-
300
-
301
-
302
-
303
-
304
-
305
-
306
-
307
-
308
-
309
-
310
-
311
-
312
-
313
-
314
-
315
-
316
-
317
-
318
-
319
-
320
-
321
-
322
-
323
-
324
-
325
-
326
-
327
-
328
-
329
-
330
-
331
-
332
-
333
-
334
-
335
-
336
-
337
-
338
-
339
-
340
-
341
-
342
-
343
-
344
-
345
-
346
-
347
-
348
-
349
-
350
-
351
-
352
-
353
-
354
-
355
-
356
-
357
-
358
-
359
-
360
-
361
-
362
-
363
-
364
-
365
-
366
-
367
-
368
-
369
-
370
-
371
-
372
-
373
-
374
-
375
-
376
-
377
-
378
-
379
-
380
-
381
-
382
-
383
-
384
-
385
-
386
-
387
-
388
-
389
-
390
-
391
-
392
-
393
-
394
-
395
-
396
-
397
-
398
-
399
-
400
-
401
-
402
-
403
-
404
-
405
-
406
-
407
-
408
-
409
-
410
-
411
-
412
-
413
-
414
-
415
-
416
-
417
-
418
-
419
-
420
-
421
-
422
-
423
-
424
-
425
-
426
-
427
-
428
-
429
-
430
-
431
-
432
-
433
-
434
-
435
-
436
-
437
-
438
-
439
-
440
-
441
-
442
-
443
-
444
-
445
 |
 |

Risk management: Credit risk continued
Credit risk assets* continued
Key credit portfolios continued
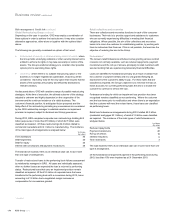
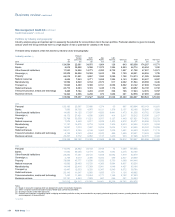
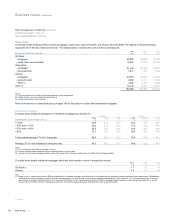
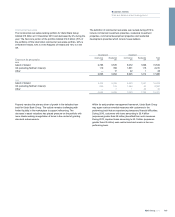
Retail assets
The Group's retail lending portfolio includes mortgages, credit cards, unsecured loans, auto finance and overdrafts. The majority of personal lending
exposures are in the UK, Ireland and the US. The analysis below includes both Core and Non-Core balances.
Personal credit risk assets (1) 2010
£m
2009
£m
2008
£m
UK Retail
- mortgages 92,592 85,529 74,528
- cards, loans and overdrafts 18,072 20,316 22,475
Ulster Bank
- mortgages 21,162 22,304 24,531
- other personal 1,017 1,172 1,350
Citizens
- mortgages 24,575 26,534 34,394
- auto and cards 6,062 6,917 9,126
- other (2) 3,455 4,205 5,286
Other (3) 18,123 16,827 24,764
185,058 183,804 196,454
Notes:
(1) Prior years have been revised to reflect improvements in data categorisation.
(2) Mainly student loans and recreational vehicles/marine.
(3) Personal exposures in other divisions.
Refer to the section on Ulster Bank group on page 164 for discussion on Ulster Bank residential mortgages.
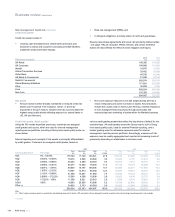
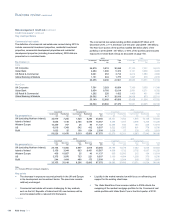
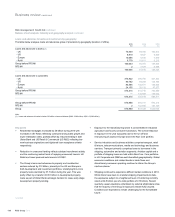
Residential mortgages
The table below details the distribution of residential mortgages by indexed LTV.
UK Retail Citizens
Distribution by average LTV (1) 2010
%
2009
%
2008
%
2010
%
2009 (2)
%
2008
%
<= 50% 38.5 39.2 46.1 25.8 26.4 29.7
>50% and <= 70% 23.2 21.0 21.5 17.3 16.6 19.7
>70% and <= 90% 26.2 24.5 19.7 27.4 26.3 31.8
>90% 12.1 15.3 12.7 29.5 30.7 18.8
Total portfolio average LTV at 31 December 58.2 59.1 54.5 75.3 74.5 69.1
Average LTV on new originations during the year 64.2 67.2 67.2 64.8 62.6 64.3
Notes:
(1) LTV averages are calculated by transaction volume.
(2) Revised to reflect updated data and analysis completed after the reporting date.
(3) Analysis covers the main mortgage brands in each of the Group’s three consumer markets and covers 96% of total mortgage portfolio.
The table below details residential mortgages which are three months or more in arrears (by volume).
2010 2009 2008
% %%
UK Retail (1) 1.7 1.6 1.3
Citizens 1.4 1.5 0.9
Note:
(1) Based on the 3+ months arrears rate for RBS and NatWest (81% of standard mortgages as at December 2010) together with the equivalent manually applied collections status flag for RBS/NatWest
‘Offset’ and other brand mortgages; in total 93% of total mortgage assets. The ‘One Account’ current account mortgage is excluded (£6.7 billion of assets - 7% of assets) of which 0.8% of accounts
were 90 days continually in excess of the limit at 31 December 2010 (2009 - 0.6%). Consistent with the way the Council of Mortgage Lenders publishes member arrears information the 3+ month’s
arrears rate now excludes accounts in repossession and cases with shortfalls post property sale; 2009 data have been revised accordingly.
*unaudited
RBS Group 2010158
Business review continued