RBS 2010 Annual Report Download - page 181
Download and view the complete annual report
Please find page 181 of the 2010 RBS annual report below. You can navigate through the pages in the report by either clicking on the pages listed below, or by using the keyword search tool below to find specific information within the annual report.-
 1
1 -
2
-
3
-
4
-
5
-
6
-
7
-
8
-
9
-
10
-
11
-
12
-
13
-
14
-
15
-
16
-
17
-
18
-
19
-
20
-
21
-
22
-
23
-
24
-
25
-
26
-
27
-
28
-
29
-
30
-
31
-
32
-
33
-
34
-
35
-
36
-
37
-
38
-
39
-
40
-
41
-
42
-
43
-
44
-
45
-
46
-
47
-
48
-
49
-
50
-
51
-
52
-
53
-
54
-
55
-
56
-
57
-
58
-
59
-
60
-
61
-
62
-
63
-
64
-
65
-
66
-
67
-
68
-
69
-
70
-
71
-
72
-
73
-
74
-
75
-
76
-
77
-
78
-
79
-
80
-
81
-
82
-
83
-
84
-
85
-
86
-
87
-
88
-
89
-
90
-
91
-
92
-
93
-
94
-
95
-
96
-
97
-
98
-
99
-
100
-
101
-
102
-
103
-
104
-
105
-
106
-
107
-
108
-
109
-
110
-
111
-
112
-
113
-
114
-
115
-
116
-
117
-
118
-
119
-
120
-
121
-
122
-
123
-
124
-
125
-
126
-
127
-
128
-
129
-
130
-
131
-
132
-
133
-
134
-
135
-
136
-
137
-
138
-
139
-
140
-
141
-
142
-
143
-
144
-
145
-
146
-
147
-
148
-
149
-
150
-
151
-
152
-
153
-
154
-
155
-
156
-
157
-
158
-
159
-
160
-
161
-
162
-
163
-
164
-
165
-
166
-
167
-
168
-
169
-
170
-
 171
171 -
 172
172 -
 173
173 -
 174
174 -
 175
175 -
 176
176 -
 177
177 -
 178
178 -
 179
179 -
 180
180 -
 181
181 -
 182
182 -
 183
183 -
 184
184 -
 185
185 -
 186
186 -
 187
187 -
 188
188 -
 189
189 -
 190
190 -
 191
191 -
192
-
193
-
194
-
195
-
196
-
197
-
198
-
199
-
200
-
201
-
202
-
203
-
204
-
205
-
206
-
207
-
208
-
209
-
210
-
211
-
212
-
213
-
214
-
215
-
216
-
217
-
218
-
219
-
220
-
221
-
222
-
223
-
224
-
225
-
226
-
227
-
228
-
229
-
230
-
231
-
232
-
233
-
234
-
235
-
236
-
237
-
238
-
239
-
240
-
241
-
242
-
243
-
244
-
245
-
246
-
247
-
248
-
249
-
250
-
251
-
252
-
253
-
254
-
255
-
256
-
257
-
258
-
259
-
260
-
261
-
262
-
263
-
264
-
265
-
266
-
267
-
268
-
269
-
270
-
271
-
272
-
273
-
274
-
275
-
276
-
277
-
278
-
279
-
280
-
281
-
282
-
283
-
284
-
285
-
286
-
287
-
288
-
289
-
290
-
291
-
292
-
293
-
294
-
295
-
296
-
297
-
298
-
299
-
300
-
301
-
302
-
303
-
304
-
305
-
306
-
307
-
308
-
309
-
310
-
311
-
312
-
313
-
314
-
315
-
316
-
317
-
318
-
319
-
320
-
321
-
322
-
323
-
324
-
325
-
326
-
327
-
328
-
329
-
330
-
331
-
332
-
333
-
334
-
335
-
336
-
337
-
338
-
339
-
340
-
341
-
342
-
343
-
344
-
345
-
346
-
347
-
348
-
349
-
350
-
351
-
352
-
353
-
354
-
355
-
356
-
357
-
358
-
359
-
360
-
361
-
362
-
363
-
364
-
365
-
366
-
367
-
368
-
369
-
370
-
371
-
372
-
373
-
374
-
375
-
376
-
377
-
378
-
379
-
380
-
381
-
382
-
383
-
384
-
385
-
386
-
387
-
388
-
389
-
390
-
391
-
392
-
393
-
394
-
395
-
396
-
397
-
398
-
399
-
400
-
401
-
402
-
403
-
404
-
405
-
406
-
407
-
408
-
409
-
410
-
411
-
412
-
413
-
414
-
415
-
416
-
417
-
418
-
419
-
420
-
421
-
422
-
423
-
424
-
425
-
426
-
427
-
428
-
429
-
430
-
431
-
432
-
433
-
434
-
435
-
436
-
437
-
438
-
439
-
440
-
441
-
442
-
443
-
444
-
445
 |
 |

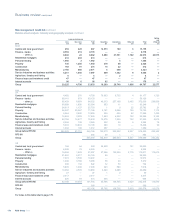
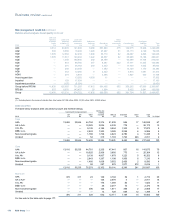
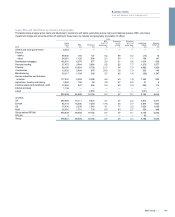
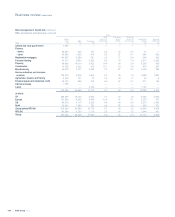
Derivatives
The table below analyses the Group’s derivative assets by internal credit quality banding and residual maturity. Master netting agreements in respect of
mark-to-market (mtm) values and collateral do not result in a net presentation in the Group’s balance sheet under IFRS.
2010
0-3
months
£m
3-6
months
£m
6-12
months
£m
1-5
years
£m
Over 5
years
£m
Total
£m
2009
Total
£m
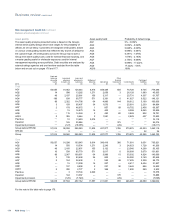
AQ1 30,840 10,755 17,554 135,311 214,029 408,489 389,019
AQ2 319 105 212 1,561 462 2,659
11,550
AQ3 1,284 391 626 610 406 3,317
10,791
AQ4 989 155 240 1,726 281 3,391 8,296
AQ5 1,016 81 201 1,447 2,115 4,860
8,270
AQ6 134 46 71 653 166 1,070
2,548
AQ7 150 29 44 375 259 857
2,181
AQ8 21 10 118 272 403
1,448
AQ9 104 8 39 110 189 450
2,030
AQ10 170 11 52 353 995 1,581
2,026
Accruing past due —— — — — — 40
35,008 11,582 19,049 142,264 219,174 427,077 438,199
RFS MI —3,255
Group 427,077 441,454
Counterparty mtm netting (330,397) (358,917)
Cash collateral held against derivative exposures (1) (31,096) (33,667)
Net exposure 65,584 48,870
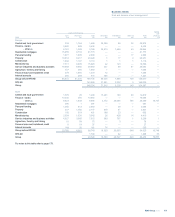
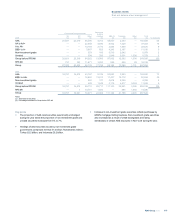
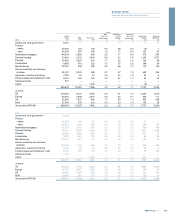
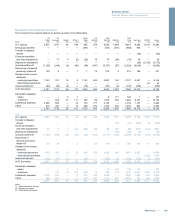
The tables below analyse the Group’s derivative assets by contract type and residual maturity and the effect of position netting and collateral.
Contract type
0-3
months
£m
3-6
months
£m
6-12
months
£m
1-5
years
£m
Over 5
years
£m
Total
£m
Counterparty
mtm netting
£m
Net
exposure
£m
2010
Exchange rate 28,938 7,820 9,360 23,174 13,961 83,253 (69,509) 13,744
Interest rate 4,822 3,533 7,927 104,026 191,423 311,731 (236,513) 75,218
Credit derivatives 497 99 313 12,374 13,589 26,872 (22,728) 4,144
Equity and commodity 751 130 1,449 2,690 201 5,221 (1,647) 3,574
35,008 11,582 19,049 142,264 219,174 427,077 (330,397) 96,680
Cash collateral held against derivative exposures (1) (31,096)
Net exposure 65,584
2009
Exchange rate 19,127 5,824 7,603 23,831 11,967 68,352 (47,885) 20,467
Interest rate 8,415 8,380 16,723 111,144 176,799 321,461 (270,791) 50,670
Credit derivatives 201 112 390 19,859 21,186 41,748 (36,411) 5,337
Equity and commodity 1,562 436 1,109 3,057 474 6,638 (3,830) 2,808
29,305 14,752 25,825 157,891 210,426 438,199 (358,917) 79,282
RFS MI 3,255 — 3,255
Group 441,454 (358,917) 82,537
Cash collateral held against derivative exposures (1) (33,667)
Net exposure 48,870
Note:
(1) As at 31 December 2010, in addition to cash collateral the Group holds collateral in the form of securities of £2.9 billion (2009 - £3.6 billion) against derivative positions.
179RBS Group 2010
Business review
Risk and balance sheet management