RBS 2010 Annual Report Download - page 316
Download and view the complete annual report
Please find page 316 of the 2010 RBS annual report below. You can navigate through the pages in the report by either clicking on the pages listed below, or by using the keyword search tool below to find specific information within the annual report.-
 1
1 -
2
-
3
-
4
-
5
-
6
-
7
-
8
-
9
-
10
-
11
-
12
-
13
-
14
-
15
-
16
-
17
-
18
-
19
-
20
-
21
-
22
-
23
-
24
-
25
-
26
-
27
-
28
-
29
-
30
-
31
-
32
-
33
-
34
-
35
-
36
-
37
-
38
-
39
-
40
-
41
-
42
-
43
-
44
-
45
-
46
-
47
-
48
-
49
-
50
-
51
-
52
-
53
-
54
-
55
-
56
-
57
-
58
-
59
-
60
-
61
-
62
-
63
-
64
-
65
-
66
-
67
-
68
-
69
-
70
-
71
-
72
-
73
-
74
-
75
-
76
-
77
-
78
-
79
-
80
-
81
-
82
-
83
-
84
-
85
-
86
-
87
-
88
-
89
-
90
-
91
-
92
-
93
-
94
-
95
-
96
-
97
-
98
-
99
-
100
-
101
-
102
-
103
-
104
-
105
-
106
-
107
-
108
-
109
-
110
-
111
-
112
-
113
-
114
-
115
-
116
-
117
-
118
-
119
-
120
-
121
-
122
-
123
-
124
-
125
-
126
-
127
-
128
-
129
-
130
-
131
-
132
-
133
-
134
-
135
-
136
-
137
-
138
-
139
-
140
-
141
-
142
-
143
-
144
-
145
-
146
-
147
-
148
-
149
-
150
-
151
-
152
-
153
-
154
-
155
-
156
-
157
-
158
-
159
-
160
-
161
-
162
-
163
-
164
-
165
-
166
-
167
-
168
-
169
-
170
-
171
-
172
-
173
-
174
-
175
-
176
-
177
-
178
-
179
-
180
-
181
-
182
-
183
-
184
-
185
-
186
-
187
-
188
-
189
-
190
-
191
-
192
-
193
-
194
-
195
-
196
-
197
-
198
-
199
-
200
-
201
-
202
-
203
-
204
-
205
-
206
-
207
-
208
-
209
-
210
-
211
-
212
-
213
-
214
-
215
-
216
-
217
-
218
-
219
-
220
-
221
-
222
-
223
-
224
-
225
-
226
-
227
-
228
-
229
-
230
-
231
-
232
-
233
-
234
-
235
-
236
-
237
-
238
-
239
-
240
-
241
-
242
-
243
-
244
-
245
-
246
-
247
-
248
-
249
-
250
-
251
-
252
-
253
-
254
-
255
-
256
-
257
-
258
-
259
-
260
-
261
-
262
-
263
-
264
-
265
-
266
-
267
-
268
-
269
-
270
-
271
-
272
-
273
-
274
-
275
-
276
-
277
-
278
-
279
-
280
-
281
-
282
-
283
-
284
-
285
-
286
-
287
-
288
-
289
-
290
-
291
-
292
-
293
-
294
-
295
-
296
-
297
-
298
-
299
-
300
-
301
-
302
-
303
-
304
-
305
-
 306
306 -
 307
307 -
 308
308 -
 309
309 -
 310
310 -
 311
311 -
 312
312 -
 313
313 -
 314
314 -
 315
315 -
 316
316 -
 317
317 -
 318
318 -
 319
319 -
 320
320 -
 321
321 -
 322
322 -
 323
323 -
 324
324 -
 325
325 -
 326
326 -
327
-
328
-
329
-
330
-
331
-
332
-
333
-
334
-
335
-
336
-
337
-
338
-
339
-
340
-
341
-
342
-
343
-
344
-
345
-
346
-
347
-
348
-
349
-
350
-
351
-
352
-
353
-
354
-
355
-
356
-
357
-
358
-
359
-
360
-
361
-
362
-
363
-
364
-
365
-
366
-
367
-
368
-
369
-
370
-
371
-
372
-
373
-
374
-
375
-
376
-
377
-
378
-
379
-
380
-
381
-
382
-
383
-
384
-
385
-
386
-
387
-
388
-
389
-
390
-
391
-
392
-
393
-
394
-
395
-
396
-
397
-
398
-
399
-
400
-
401
-
402
-
403
-
404
-
405
-
406
-
407
-
408
-
409
-
410
-
411
-
412
-
413
-
414
-
415
-
416
-
417
-
418
-
419
-
420
-
421
-
422
-
423
-
424
-
425
-
426
-
427
-
428
-
429
-
430
-
431
-
432
-
433
-
434
-
435
-
436
-
437
-
438
-
439
-
440
-
441
-
442
-
443
-
444
-
445
 |
 |

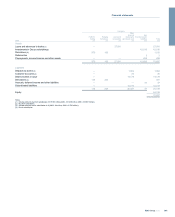
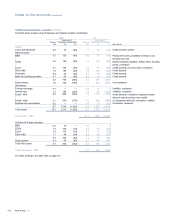
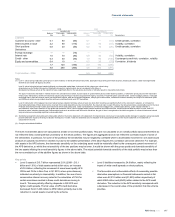
12 Financial instruments - valuation continued
Valuation hierarchy
The following tables show financial instruments carried at fair value on the Group’s balance sheet by valuation hierarchy - level 1, level 2 and level 3.
2010
2009 2008
Level 1 Level 2 Level 3 Total Level 1 Level 2 Level 3 Total Level 1 Level 2 Level 3 Total
£bn £bn £bn £bn £bn £bn £bn £bn £bn £bn £bn £bn
Assets
Loans and advances to banks
Reverse repos —38.2 — 38.2 —26.9 — 26.9 — 26.1 — 26.1
Collateral — 25.1 — 25.1 —18.4 — 18.4 — 29.7 — 29.7
Other — 0.6 0.4 1.0 —0.1 — 0.1 — 0.4 — 0.4
— 63.9 0.4 64.3 —45.4 — 45.4 — 56.2 — 56.2
Loans and advances to customers
Reverse repos — 41.1 — 41.1 —26.3 — 26.3 — 22.5 — 22.5
Collateral — 14.4 — 14.4 —9.6 — 9.6 — 14.2 — 14.2
Other — 6.2 0.4 6.6 —7.3 1.1 8.4 — 13.8 3.1 16.9
— 61.7 0.4 62.1 —43.2 1.1 44.3 — 50.5 3.1 53.6
Debt securities
Government 110.2 13.7 — 123.9 130.1 16.7 — 146.8 68.7 37.2 — 105.9
MBS — 49.5 0.7 50.2 —61.2 0.6 61.8 — 75.6 1.1 76.7
CDOs — 1.0 2.4 3.4 —2.6 1.0 3.6 — 6.9 1.7 8.6
CLOs — 3.6 2.1 5.7 —8.0 0.8 8.8 — 7.7 1.0 8.7
Other ABS — 4.0 1.4 5.4 —5.2 0.9 6.1 — 6.6 1.5 8.1
Corporate — 7.7 0.9 8.6 —10.8 0.6 11.4 0.9 15.8 1.3 18.0
Banks and building societies 0.1 12.2 0.7 13.0 0.2 17.5 0.2 17.9 4.0 20.0 0.3 24.3
Other —0.2 — 0.2 —1.0 — 1.0 0.1 4.2 — 4.3
110.3 91.9 8.2 210.4 130.3 123.0 4.1 257.4 73.7 174.0 6.9 254.6
Equity shares 18.4 2.8 1.0 22.2 15.4 2.6 1.5 19.5 15.4 9.8 1.1 26.3
Derivatives
Foreign exchange —83.2 0.1 83.3 —69.2 0.2 69.4 2.2 171.0 0.1 173.3
Interest rate 1.7 308.3 1.7 311.7 0.3 321.8 1.5 323.6 0.4 652.9 1.5 654.8
Credit - APS — — 0.6 0.6 — — 1.4 1.4 — — — —
Credit - other —23.2 3.1 26.3 0.1 37.2 3.0 40.3 0.8 133.6 8.0 142.4
Equities and commodities 0.1 4.9 0.2 5.2 0.4 6.1 0.3 6.8 0.5 20.9 0.7 22.1
1.8 419.6 5.7 427.1 0.8 434.3 6.4 441.5 3.9 978.4 10.3 992.6
Total assets 130.5 639.9 15.7 786.1 146.5 648.5 13.1 808.1 93.0 1,268.9 21.4 1,383.3
Of which:
Core 129.4 617.6 7.2 754.2
Non-Core 1.1 22.3 8.5 31.9
130.5 639.9 15.7 786.1
Of which AFS debt securities:
Government 53.0 6.4 — 59.4 70.1 7.5 — 77.6 16.4 33.6 — 50.0
MBS — 31.1 0.4 31.5 —39.1 0.2 39.3 — 45.6 0.4 46.0
CDOs —0.6 1.4 2.0 —1.2 0.4 1.6 — 3.6 0.6 4.2
CLOs —3.5 1.5 5.0 —5.4 0.1 5.5 — 4.7 0.6 5.3
Other ABS —2.9 1.1 4.0 —4.0 0.6 4.6 — 5.5 1.0 6.5
Corporate —2.0 —2.0 —3.3 — 3.3 0.6 4.4 0.4 5.4
Banks and building societies 0.1 7.1 —7.2 0.2 11.0 — 11.2 3.8 9.3 — 13.1
Other — — ———0.2 — 0.2 0.1 2.2 — 2.3
53.1 53.6 4.4 111.1 70.3 71.7 1.3 143.3 20.9 108.9 3.0 132.8
Equity shares 0.3 1.4 0.3 2.0 0.5 1.7 0.7 2.9 4.8 2.1 0.3 7.2
Total AFS assets 53.4 55.0 4.7 113.1 70.8 73.4 2.0 146.2 25.7 111.0 3.3 140.0
Of which:
Core 52.8 49.2 1.0 103.0
Non-Core 0.6 5.8 3.7 10.1
53.4 55.0 4.7 113.1
RBS Group 2010314
Notes on the accounts continued