RBS 2010 Annual Report Download - page 319
Download and view the complete annual report
Please find page 319 of the 2010 RBS annual report below. You can navigate through the pages in the report by either clicking on the pages listed below, or by using the keyword search tool below to find specific information within the annual report.-
 1
1 -
2
-
3
-
4
-
5
-
6
-
7
-
8
-
9
-
10
-
11
-
12
-
13
-
14
-
15
-
16
-
17
-
18
-
19
-
20
-
21
-
22
-
23
-
24
-
25
-
26
-
27
-
28
-
29
-
30
-
31
-
32
-
33
-
34
-
35
-
36
-
37
-
38
-
39
-
40
-
41
-
42
-
43
-
44
-
45
-
46
-
47
-
48
-
49
-
50
-
51
-
52
-
53
-
54
-
55
-
56
-
57
-
58
-
59
-
60
-
61
-
62
-
63
-
64
-
65
-
66
-
67
-
68
-
69
-
70
-
71
-
72
-
73
-
74
-
75
-
76
-
77
-
78
-
79
-
80
-
81
-
82
-
83
-
84
-
85
-
86
-
87
-
88
-
89
-
90
-
91
-
92
-
93
-
94
-
95
-
96
-
97
-
98
-
99
-
100
-
101
-
102
-
103
-
104
-
105
-
106
-
107
-
108
-
109
-
110
-
111
-
112
-
113
-
114
-
115
-
116
-
117
-
118
-
119
-
120
-
121
-
122
-
123
-
124
-
125
-
126
-
127
-
128
-
129
-
130
-
131
-
132
-
133
-
134
-
135
-
136
-
137
-
138
-
139
-
140
-
141
-
142
-
143
-
144
-
145
-
146
-
147
-
148
-
149
-
150
-
151
-
152
-
153
-
154
-
155
-
156
-
157
-
158
-
159
-
160
-
161
-
162
-
163
-
164
-
165
-
166
-
167
-
168
-
169
-
170
-
171
-
172
-
173
-
174
-
175
-
176
-
177
-
178
-
179
-
180
-
181
-
182
-
183
-
184
-
185
-
186
-
187
-
188
-
189
-
190
-
191
-
192
-
193
-
194
-
195
-
196
-
197
-
198
-
199
-
200
-
201
-
202
-
203
-
204
-
205
-
206
-
207
-
208
-
209
-
210
-
211
-
212
-
213
-
214
-
215
-
216
-
217
-
218
-
219
-
220
-
221
-
222
-
223
-
224
-
225
-
226
-
227
-
228
-
229
-
230
-
231
-
232
-
233
-
234
-
235
-
236
-
237
-
238
-
239
-
240
-
241
-
242
-
243
-
244
-
245
-
246
-
247
-
248
-
249
-
250
-
251
-
252
-
253
-
254
-
255
-
256
-
257
-
258
-
259
-
260
-
261
-
262
-
263
-
264
-
265
-
266
-
267
-
268
-
269
-
270
-
271
-
272
-
273
-
274
-
275
-
276
-
277
-
278
-
279
-
280
-
281
-
282
-
283
-
284
-
285
-
286
-
287
-
288
-
289
-
290
-
291
-
292
-
293
-
294
-
295
-
296
-
297
-
298
-
299
-
300
-
301
-
302
-
303
-
304
-
305
-
306
-
307
-
308
-
 309
309 -
 310
310 -
 311
311 -
 312
312 -
 313
313 -
 314
314 -
 315
315 -
 316
316 -
 317
317 -
 318
318 -
 319
319 -
 320
320 -
 321
321 -
 322
322 -
 323
323 -
 324
324 -
 325
325 -
 326
326 -
 327
327 -
 328
328 -
 329
329 -
330
-
331
-
332
-
333
-
334
-
335
-
336
-
337
-
338
-
339
-
340
-
341
-
342
-
343
-
344
-
345
-
346
-
347
-
348
-
349
-
350
-
351
-
352
-
353
-
354
-
355
-
356
-
357
-
358
-
359
-
360
-
361
-
362
-
363
-
364
-
365
-
366
-
367
-
368
-
369
-
370
-
371
-
372
-
373
-
374
-
375
-
376
-
377
-
378
-
379
-
380
-
381
-
382
-
383
-
384
-
385
-
386
-
387
-
388
-
389
-
390
-
391
-
392
-
393
-
394
-
395
-
396
-
397
-
398
-
399
-
400
-
401
-
402
-
403
-
404
-
405
-
406
-
407
-
408
-
409
-
410
-
411
-
412
-
413
-
414
-
415
-
416
-
417
-
418
-
419
-
420
-
421
-
422
-
423
-
424
-
425
-
426
-
427
-
428
-
429
-
430
-
431
-
432
-
433
-
434
-
435
-
436
-
437
-
438
-
439
-
440
-
441
-
442
-
443
-
444
-
445
 |
 |

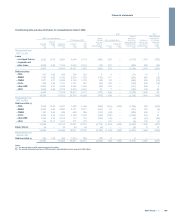
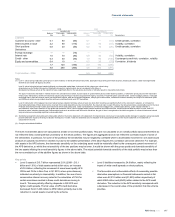
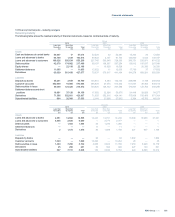
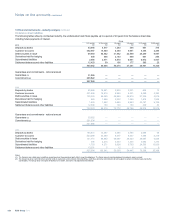
2010 2009
Sensitivity (2) Sensitivity (2)
Balance Favourable Unfavourable
Balance Favourable Unfavourable
£bn £m £m
£bn £m £m
Assumptions
Liabilities
Customer accounts - other 0.1 60 (60) 0.1 — (10) Credit spreads, correlation
Debt securities in issue 2.2 90 (110) 2.3 50 (10) Volatility, correlation
Short positions 0.8 20 (50) 0.2 10 (20) Credit spreads, correlation
Derivatives
Foreign exchange — — (10) — — —
Interest rate 1.0 70 (90) 0.8 40 (60) Volatility, correlation
Credit - other 0.3 40 (40) 1.0 80 (100) Counterparty credit risk, correlation, volatility
Equity and commodities 0.4 10 — 0.2 20 (70) Correlation, dividends
1.7 120 (140) 2.0 140 (230)
4.8 290 (360) 4.6 200 (270)
Total liabilities - 2008 9.0 550 (490)
Notes:
(1) Level 1: valued using unadjusted quoted prices in active markets, for identical financial instruments. Examples include G10 government securities, listed equity shares, certain exchange-traded
derivatives and certain US agency securities.
Level 2: valued using techniques based significantly on observable market data. Instruments in this category are valued using:
(a) quoted prices for similar instruments or identical instruments in markets which are not considered to be active; or
(b) valuation techniques where all the inputs that have a significant effect on the valuations are directly or indirectly based on observable market data.
The type of instruments that trade in markets that are not considered to be active, but are based on quoted market prices, banker dealer quotations, or alternative pricing sources with reasonable
levels of price transparency and those instruments valued using techniques include most government agency securities, investment-grade corporate bonds, certain mortgage products, most bank
and bridge loans, repos and reverse repos, less liquid listed equities, state and municipal obligations, most physical commodities, investment contracts issued by the Group's life assurance (2009
and 2008) and certain money market securities and loan commitments and most OTC derivatives.
Level 3: instruments in this category have been valued using a valuation technique where at least one input which could have a significant effect on the instrument’s valuation, is not based on
observable market data. Where inputs can be observed from market data without undue cost and effort, the observed input is used. Otherwise, the Group determines a reasonable level for the input.
Financial instruments primarily include cash instruments which trade infrequently, certain syndicated and commercial mortgage loans, unlisted equity shares, certain residual interests in
securitisations, super senior tranches of high grade and mezzanine CDOs, other mortgage-based products and less liquid debt securities, certain structured debt securities in issue, and OTC
derivatives where valuation depends upon unobservable inputs such as certain credit and exotic derivatives. No gain or loss is recognised on the initial recognition of a financial instrument valued
using a technique incorporating significant unobservable data.
(2) Sensitivity represents the favourable and unfavourable effect on the income statement or the statement of comprehensive income due to reasonably possible changes to valuations using reasonably
possible alternative inputs to the Group's valuation techniques or models. Totals for sensitivities are not indicative of the total potential effect on the income statement or the statement of
comprehensive income.
(3) Comprise subordinated liabilities.
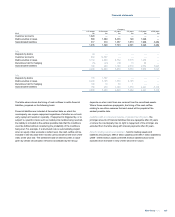
The level 3 sensitivities above are calculated at a trade or low level portfolio basis. They are not calculated on an overall portfolio basis and therefore do
not reflect the likely overall potential uncertainty on the whole portfolio. The figures are aggregated and do not reflect the correlated nature of some of
the sensitivities. In particular, for some of the portfolios the sensitivities may be negatively correlated where a downwards movement in one asset would
produce an upwards movement in another, but due to the additive presentation of the above figures this correlation cannot be observed. For example,
with assets in the APS scheme, the downwards sensitivity on the underlying asset would be materially offset by the consequent upward movement of
the APS derivative, so whilst the net sensitivity of the two positions may be lower, it would be shown with the gross upside and downside sensitivity of
the two assets inflating the overall sensitivity figures in the above table. The actual potential downside sensitivity of the total portfolio may be less than
the non-correlated sum of the additive figures as shown in the above table.
Key points
xLevel 3 assets of £15.7 billion represented 2.0% (2009 - £13.1
billion and 1.6%) of total assets carried at fair value, an increase
of £2.6 billion, reflecting the movement of some lower quality AFS
CDOs and CLOs in Non-Core in Q1 2010, where price discovery
indicated uncertainty in observability. In addition, the use of more
conservative internal recovery rates for the calculation of CVA for
certain monolines resulted in these credit derivatives moving to
level 3. This was partially offset by disposals in Q3 2010 and
tighter credit spreads. The fair value of APS credit derivative
decreased from £1,400 million to £550 million primarily due to the
reduction in overall assets covered by the scheme.
xLevel 3 liabilities increased to £4.8 billion, mainly reflecting the
impact of wider credit spreads on short positions.
xThe favourable and unfavourable effects of reasonably possible
alternative assumptions on financial instruments carried at fair
value were £2,310 million and (£1,820) million respectively of
which £860 million and (£940) million related to the APS credit
derivative. The reduction in the APS sensitivity corresponds with
adecrease in the overall value of the protection that the scheme
provides.
317RBS Group 2010
Financial statements