RBS 2010 Annual Report Download - page 195
Download and view the complete annual report
Please find page 195 of the 2010 RBS annual report below. You can navigate through the pages in the report by either clicking on the pages listed below, or by using the keyword search tool below to find specific information within the annual report.-
 1
1 -
2
-
3
-
4
-
5
-
6
-
7
-
8
-
9
-
10
-
11
-
12
-
13
-
14
-
15
-
16
-
17
-
18
-
19
-
20
-
21
-
22
-
23
-
24
-
25
-
26
-
27
-
28
-
29
-
30
-
31
-
32
-
33
-
34
-
35
-
36
-
37
-
38
-
39
-
40
-
41
-
42
-
43
-
44
-
45
-
46
-
47
-
48
-
49
-
50
-
51
-
52
-
53
-
54
-
55
-
56
-
57
-
58
-
59
-
60
-
61
-
62
-
63
-
64
-
65
-
66
-
67
-
68
-
69
-
70
-
71
-
72
-
73
-
74
-
75
-
76
-
77
-
78
-
79
-
80
-
81
-
82
-
83
-
84
-
85
-
86
-
87
-
88
-
89
-
90
-
91
-
92
-
93
-
94
-
95
-
96
-
97
-
98
-
99
-
100
-
101
-
102
-
103
-
104
-
105
-
106
-
107
-
108
-
109
-
110
-
111
-
112
-
113
-
114
-
115
-
116
-
117
-
118
-
119
-
120
-
121
-
122
-
123
-
124
-
125
-
126
-
127
-
128
-
129
-
130
-
131
-
132
-
133
-
134
-
135
-
136
-
137
-
138
-
139
-
140
-
141
-
142
-
143
-
144
-
145
-
146
-
147
-
148
-
149
-
150
-
151
-
152
-
153
-
154
-
155
-
156
-
157
-
158
-
159
-
160
-
161
-
162
-
163
-
164
-
165
-
166
-
167
-
168
-
169
-
170
-
171
-
172
-
173
-
174
-
175
-
176
-
177
-
178
-
179
-
180
-
181
-
182
-
183
-
184
-
 185
185 -
 186
186 -
 187
187 -
 188
188 -
 189
189 -
 190
190 -
 191
191 -
 192
192 -
 193
193 -
 194
194 -
 195
195 -
 196
196 -
 197
197 -
 198
198 -
 199
199 -
 200
200 -
 201
201 -
 202
202 -
 203
203 -
 204
204 -
 205
205 -
206
-
207
-
208
-
209
-
210
-
211
-
212
-
213
-
214
-
215
-
216
-
217
-
218
-
219
-
220
-
221
-
222
-
223
-
224
-
225
-
226
-
227
-
228
-
229
-
230
-
231
-
232
-
233
-
234
-
235
-
236
-
237
-
238
-
239
-
240
-
241
-
242
-
243
-
244
-
245
-
246
-
247
-
248
-
249
-
250
-
251
-
252
-
253
-
254
-
255
-
256
-
257
-
258
-
259
-
260
-
261
-
262
-
263
-
264
-
265
-
266
-
267
-
268
-
269
-
270
-
271
-
272
-
273
-
274
-
275
-
276
-
277
-
278
-
279
-
280
-
281
-
282
-
283
-
284
-
285
-
286
-
287
-
288
-
289
-
290
-
291
-
292
-
293
-
294
-
295
-
296
-
297
-
298
-
299
-
300
-
301
-
302
-
303
-
304
-
305
-
306
-
307
-
308
-
309
-
310
-
311
-
312
-
313
-
314
-
315
-
316
-
317
-
318
-
319
-
320
-
321
-
322
-
323
-
324
-
325
-
326
-
327
-
328
-
329
-
330
-
331
-
332
-
333
-
334
-
335
-
336
-
337
-
338
-
339
-
340
-
341
-
342
-
343
-
344
-
345
-
346
-
347
-
348
-
349
-
350
-
351
-
352
-
353
-
354
-
355
-
356
-
357
-
358
-
359
-
360
-
361
-
362
-
363
-
364
-
365
-
366
-
367
-
368
-
369
-
370
-
371
-
372
-
373
-
374
-
375
-
376
-
377
-
378
-
379
-
380
-
381
-
382
-
383
-
384
-
385
-
386
-
387
-
388
-
389
-
390
-
391
-
392
-
393
-
394
-
395
-
396
-
397
-
398
-
399
-
400
-
401
-
402
-
403
-
404
-
405
-
406
-
407
-
408
-
409
-
410
-
411
-
412
-
413
-
414
-
415
-
416
-
417
-
418
-
419
-
420
-
421
-
422
-
423
-
424
-
425
-
426
-
427
-
428
-
429
-
430
-
431
-
432
-
433
-
434
-
435
-
436
-
437
-
438
-
439
-
440
-
441
-
442
-
443
-
444
-
445
 |
 |

Market risk
All the disclosures in this section (pages 193 to 198) are audited unless
indicated otherwise with an asterisk (*).
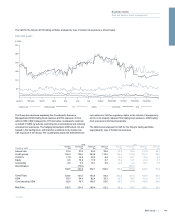
Market risk arises from changes in interest rates, foreign currency, credit
spread, equity prices and risk related factors such as market volatilities.
The Group manages market risk centrally within its trading and non-
trading portfolios through a comprehensive market risk management
framework. This framework includes limits based on, but not limited to,
value-at-risk (VaR), stress testing, positions and sensitivity analyses.
The majority of market risk exposure is in GBM and Non-Core. The
Group is also exposed to market risk through interest rate risk on its non-
trading activities. There are additional non-trading market risks in the
Retail and Commercial businesses of the Group, principally interest rate
risk and foreign exchange risk. These aspects are discussed in more
detail in Balance sheet management - Interest rate risk on page 143 and
structural foreign currency exposures on page 144.
Organisation and structure
The Executive Risk Forum approves market risk appetite for trading and
non-trading activities. The Global Head of Market & Insurance Risk is
responsible for the Group Market Risk Control Framework and under
delegated authority from the Executive Risk Forum, sets a limit
framework within the context of the approved market risk appetite, which
is cascaded down through legal entity, division, business and desk level
market risk limits.
Adaily report summarises the Group’s market risk exposures against
agreed limits. This daily report is sent to the Head of Restructuring & Risk,
Global Head of Market & Insurance Risk, business Chief Risk Officers
and appropriate business Risk Managers.
The head of each business, assisted by the business risk management
team, is accountable for all market risks associated with its activities.
Oversight and support is provided to the business by the Global Head of
Market & Insurance Risk, assisted by the Group and business Market
Risk teams. The Global Market Risk Committee reviews and makes
recommendations concerning the market risk profile across the Group,
including risk appetite, limits and utilisation. The Committee meets
monthly and is chaired by the Global Head of Market Risk & Insurance
Risk. Attendees include respective business Risk Managers and Group
Market Risk.
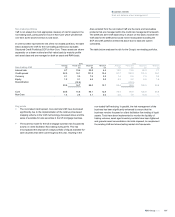
Risk measurement and control
At the Group level, the risk appetite is expressed in the form of a
combination of VaR, sensitivity and stress testing limits. VaR is a
technique that produces estimates of the potential change in the market
value of a portfolio over a specified time horizon at given confidence
levels. For internal risk management purposes, the Group’s VaR
assumes a time horizon of one trading day and a confidence level of 99%.
The Group's VaR model is based on a historical simulation model,
utilising data from the previous two years.
The VaR model has been approved by the FSA to calculate regulatory
capital for the trading book. The approval covers general market risk in
interest rate, foreign exchange, equity and limited commodity products
and specific risk in interest rate and equity products.
As the VaR model is an important market risk measurement and control
tool and is used for determining a significant component of the market
risk capital, it is regularly assessed. The main approach employed is the
technique known as back-testing which counts the number of days when
aloss (as defined by the FSA), exceeds the corresponding daily VaR
estimate, measured at a 99% confidence interval. The FSA categorises a
VaR model as green, amber or red. A green model is consistent with a
good working model and is achieved for models that have four or less
back-testing exceptions in a 12 month period. For the Group’s trading
book, a green model status was maintained throughout 2010.
The Group’s VaR should be interpreted in light of the limitations of the
methodology used, as follows:
xHistorical Simulation VaR may not provide the best estimate of
future market movements. It can only provide a prediction of the
future based on events that occurred in the 500 trading day time
series. Therefore, events that are more severe than those in the
historical data series cannot be predicted.
xThe use of a 99% confidence level does not reflect the extent of
potential losses beyond that percentile.
xThe use of a one-day time horizon will not fully capture the profit and
loss implications of positions that cannot be liquidated or hedged
within one day.
xThe Group computes the VaR of trading portfolios at the close of
business. Positions may change substantially during the course of
the trading day and intra-day profit and losses will be incurred.
These limitations mean that the Group cannot guarantee that losses will
not exceed the VaR.
Arisk not in VaR framework has been developed to quantify those
market risks not adequately captured by the market standard VaR
methodology. Where risks are not included in the model, various non-
VaR controls (for example, position monitoring, sensitivity limits, triggers
or stress limits) are in place.
The Group undertakes daily stress testing to identify the potential losses
in excess of VaR. Stress testing is used to calculate a range of trading
book exposures which result from extreme market events. Stress testing
measures the impact of exceptional changes in market rates and prices
on the fair value of the Group’s trading portfolios. The Group calculates
historical stress tests and hypothetical stress tests.
Historical stress tests calculate the loss that would be generated if the
market movements that occurred during historical market events were
repeated. Hypothetical stress tests calculate the loss that would be
generated if a specific set of adverse market movements were to occur.
193RBS Group 2010
Business review
Risk and balance sheet management