RBS 2010 Annual Report Download - page 165
Download and view the complete annual report
Please find page 165 of the 2010 RBS annual report below. You can navigate through the pages in the report by either clicking on the pages listed below, or by using the keyword search tool below to find specific information within the annual report.-
 1
1 -
2
-
3
-
4
-
5
-
6
-
7
-
8
-
9
-
10
-
11
-
12
-
13
-
14
-
15
-
16
-
17
-
18
-
19
-
20
-
21
-
22
-
23
-
24
-
25
-
26
-
27
-
28
-
29
-
30
-
31
-
32
-
33
-
34
-
35
-
36
-
37
-
38
-
39
-
40
-
41
-
42
-
43
-
44
-
45
-
46
-
47
-
48
-
49
-
50
-
51
-
52
-
53
-
54
-
55
-
56
-
57
-
58
-
59
-
60
-
61
-
62
-
63
-
64
-
65
-
66
-
67
-
68
-
69
-
70
-
71
-
72
-
73
-
74
-
75
-
76
-
77
-
78
-
79
-
80
-
81
-
82
-
83
-
84
-
85
-
86
-
87
-
88
-
89
-
90
-
91
-
92
-
93
-
94
-
95
-
96
-
97
-
98
-
99
-
100
-
101
-
102
-
103
-
104
-
105
-
106
-
107
-
108
-
109
-
110
-
111
-
112
-
113
-
114
-
115
-
116
-
117
-
118
-
119
-
120
-
121
-
122
-
123
-
124
-
125
-
126
-
127
-
128
-
129
-
130
-
131
-
132
-
133
-
134
-
135
-
136
-
137
-
138
-
139
-
140
-
141
-
142
-
143
-
144
-
145
-
146
-
147
-
148
-
149
-
150
-
151
-
152
-
153
-
154
-
 155
155 -
 156
156 -
 157
157 -
 158
158 -
 159
159 -
 160
160 -
 161
161 -
 162
162 -
 163
163 -
 164
164 -
 165
165 -
 166
166 -
 167
167 -
 168
168 -
 169
169 -
 170
170 -
 171
171 -
 172
172 -
 173
173 -
 174
174 -
 175
175 -
176
-
177
-
178
-
179
-
180
-
181
-
182
-
183
-
184
-
185
-
186
-
187
-
188
-
189
-
190
-
191
-
192
-
193
-
194
-
195
-
196
-
197
-
198
-
199
-
200
-
201
-
202
-
203
-
204
-
205
-
206
-
207
-
208
-
209
-
210
-
211
-
212
-
213
-
214
-
215
-
216
-
217
-
218
-
219
-
220
-
221
-
222
-
223
-
224
-
225
-
226
-
227
-
228
-
229
-
230
-
231
-
232
-
233
-
234
-
235
-
236
-
237
-
238
-
239
-
240
-
241
-
242
-
243
-
244
-
245
-
246
-
247
-
248
-
249
-
250
-
251
-
252
-
253
-
254
-
255
-
256
-
257
-
258
-
259
-
260
-
261
-
262
-
263
-
264
-
265
-
266
-
267
-
268
-
269
-
270
-
271
-
272
-
273
-
274
-
275
-
276
-
277
-
278
-
279
-
280
-
281
-
282
-
283
-
284
-
285
-
286
-
287
-
288
-
289
-
290
-
291
-
292
-
293
-
294
-
295
-
296
-
297
-
298
-
299
-
300
-
301
-
302
-
303
-
304
-
305
-
306
-
307
-
308
-
309
-
310
-
311
-
312
-
313
-
314
-
315
-
316
-
317
-
318
-
319
-
320
-
321
-
322
-
323
-
324
-
325
-
326
-
327
-
328
-
329
-
330
-
331
-
332
-
333
-
334
-
335
-
336
-
337
-
338
-
339
-
340
-
341
-
342
-
343
-
344
-
345
-
346
-
347
-
348
-
349
-
350
-
351
-
352
-
353
-
354
-
355
-
356
-
357
-
358
-
359
-
360
-
361
-
362
-
363
-
364
-
365
-
366
-
367
-
368
-
369
-
370
-
371
-
372
-
373
-
374
-
375
-
376
-
377
-
378
-
379
-
380
-
381
-
382
-
383
-
384
-
385
-
386
-
387
-
388
-
389
-
390
-
391
-
392
-
393
-
394
-
395
-
396
-
397
-
398
-
399
-
400
-
401
-
402
-
403
-
404
-
405
-
406
-
407
-
408
-
409
-
410
-
411
-
412
-
413
-
414
-
415
-
416
-
417
-
418
-
419
-
420
-
421
-
422
-
423
-
424
-
425
-
426
-
427
-
428
-
429
-
430
-
431
-
432
-
433
-
434
-
435
-
436
-
437
-
438
-
439
-
440
-
441
-
442
-
443
-
444
-
445
 |
 |

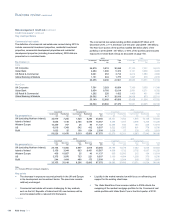
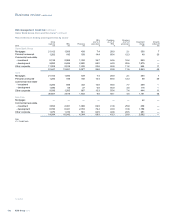
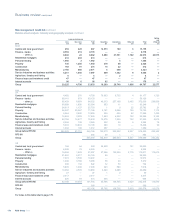
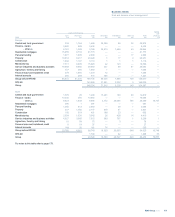
Gross
loans (1) REIL Provisions
REIL
as a % of
gross loans
Provisions
as a % of
REIL
Provisions
as a % of
gross loans
Impairment
charge
Amounts
written-off
2009 £m £m £m % % % £m £m
Ulster Bank Group
Mortgages 22,201 882 153 4.0 17.3 0.7 116 3
Personal unsecured 2,433 174 145 7.2 83.3 6.0 66 27
Commercial real estate
- investment 8,192 1,748 413 21.3 23.6 5.0 370 —
- development 10,109 4,268 1,106 42.2 25.9 10.9 953 4
Other corporate 12,479 1,976 648 15.8 32.8 5.2 421 —
55,414 9,048 2,465 16.3 27.2 4.4 1,926 34
Core
Mortgages 16,199 558 102 3.4 18.3 0.6 74 3
Personal unsecured 2,433 174 145 7.2 83.3 6.0 66 27
Commercial real estate
- investment 6,131 250 105 4.1 42.0 1.7 84 —
- development 3,838 428 284 11.2 66.4 7.4 221 4
Other corporate 11,106 850 326 7.7 38.4 2.9 204 —
39,707 2,260 962 5.7 42.6 2.4 649 34
Non-Core
Mortgages 6,002 324 51 5.4 15.7 0.8 42 —
Commercial real estate
- investment 2,061 1,498 308 72.7 20.6 14.9 286 —
- development 6,271 3,840 822 61.2 21.4 13.1 732 —
Other corporate 1,373 1,126 322 82.0 28.6 23.5 217 —
15,707 6,788 1,503 43.2 22.1 9.6 1,277 —
Note:
(1) Funded loans.
Key points
xIncreases in REIL reflect difficult conditions in both commercial and
residential sectors in the Republic of Ireland. Of the REIL at 31
December 2010, 74% was in Non-Core.
xProvisions increased from £2.5 billion to £6.0 billion and the
coverage ratio increased to 44% from 27% at 31 December 2009.
69% of the provision at 31 December 2010 related to commercial
real estate.
163RBS Group 2010
Business review
Risk and balance sheet management