RBS 2010 Annual Report Download - page 216
Download and view the complete annual report
Please find page 216 of the 2010 RBS annual report below. You can navigate through the pages in the report by either clicking on the pages listed below, or by using the keyword search tool below to find specific information within the annual report.-
 1
1 -
2
-
3
-
4
-
5
-
6
-
7
-
8
-
9
-
10
-
11
-
12
-
13
-
14
-
15
-
16
-
17
-
18
-
19
-
20
-
21
-
22
-
23
-
24
-
25
-
26
-
27
-
28
-
29
-
30
-
31
-
32
-
33
-
34
-
35
-
36
-
37
-
38
-
39
-
40
-
41
-
42
-
43
-
44
-
45
-
46
-
47
-
48
-
49
-
50
-
51
-
52
-
53
-
54
-
55
-
56
-
57
-
58
-
59
-
60
-
61
-
62
-
63
-
64
-
65
-
66
-
67
-
68
-
69
-
70
-
71
-
72
-
73
-
74
-
75
-
76
-
77
-
78
-
79
-
80
-
81
-
82
-
83
-
84
-
85
-
86
-
87
-
88
-
89
-
90
-
91
-
92
-
93
-
94
-
95
-
96
-
97
-
98
-
99
-
100
-
101
-
102
-
103
-
104
-
105
-
106
-
107
-
108
-
109
-
110
-
111
-
112
-
113
-
114
-
115
-
116
-
117
-
118
-
119
-
120
-
121
-
122
-
123
-
124
-
125
-
126
-
127
-
128
-
129
-
130
-
131
-
132
-
133
-
134
-
135
-
136
-
137
-
138
-
139
-
140
-
141
-
142
-
143
-
144
-
145
-
146
-
147
-
148
-
149
-
150
-
151
-
152
-
153
-
154
-
155
-
156
-
157
-
158
-
159
-
160
-
161
-
162
-
163
-
164
-
165
-
166
-
167
-
168
-
169
-
170
-
171
-
172
-
173
-
174
-
175
-
176
-
177
-
178
-
179
-
180
-
181
-
182
-
183
-
184
-
185
-
186
-
187
-
188
-
189
-
190
-
191
-
192
-
193
-
194
-
195
-
196
-
197
-
198
-
199
-
200
-
201
-
202
-
203
-
204
-
205
-
 206
206 -
 207
207 -
 208
208 -
 209
209 -
 210
210 -
 211
211 -
 212
212 -
 213
213 -
 214
214 -
 215
215 -
 216
216 -
 217
217 -
 218
218 -
 219
219 -
 220
220 -
 221
221 -
 222
222 -
 223
223 -
 224
224 -
 225
225 -
 226
226 -
227
-
228
-
229
-
230
-
231
-
232
-
233
-
234
-
235
-
236
-
237
-
238
-
239
-
240
-
241
-
242
-
243
-
244
-
245
-
246
-
247
-
248
-
249
-
250
-
251
-
252
-
253
-
254
-
255
-
256
-
257
-
258
-
259
-
260
-
261
-
262
-
263
-
264
-
265
-
266
-
267
-
268
-
269
-
270
-
271
-
272
-
273
-
274
-
275
-
276
-
277
-
278
-
279
-
280
-
281
-
282
-
283
-
284
-
285
-
286
-
287
-
288
-
289
-
290
-
291
-
292
-
293
-
294
-
295
-
296
-
297
-
298
-
299
-
300
-
301
-
302
-
303
-
304
-
305
-
306
-
307
-
308
-
309
-
310
-
311
-
312
-
313
-
314
-
315
-
316
-
317
-
318
-
319
-
320
-
321
-
322
-
323
-
324
-
325
-
326
-
327
-
328
-
329
-
330
-
331
-
332
-
333
-
334
-
335
-
336
-
337
-
338
-
339
-
340
-
341
-
342
-
343
-
344
-
345
-
346
-
347
-
348
-
349
-
350
-
351
-
352
-
353
-
354
-
355
-
356
-
357
-
358
-
359
-
360
-
361
-
362
-
363
-
364
-
365
-
366
-
367
-
368
-
369
-
370
-
371
-
372
-
373
-
374
-
375
-
376
-
377
-
378
-
379
-
380
-
381
-
382
-
383
-
384
-
385
-
386
-
387
-
388
-
389
-
390
-
391
-
392
-
393
-
394
-
395
-
396
-
397
-
398
-
399
-
400
-
401
-
402
-
403
-
404
-
405
-
406
-
407
-
408
-
409
-
410
-
411
-
412
-
413
-
414
-
415
-
416
-
417
-
418
-
419
-
420
-
421
-
422
-
423
-
424
-
425
-
426
-
427
-
428
-
429
-
430
-
431
-
432
-
433
-
434
-
435
-
436
-
437
-
438
-
439
-
440
-
441
-
442
-
443
-
444
-
445
 |
 |
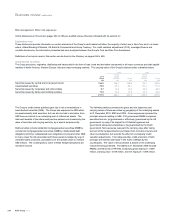
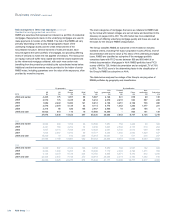
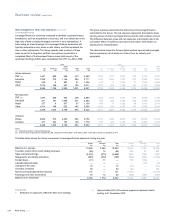
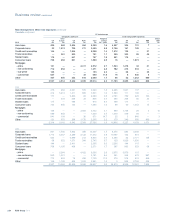
Risk management: Other risk exposures continued
Credit derivative product companies continued
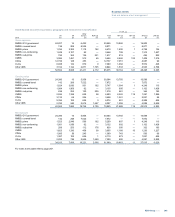
The table belowdetails CDPC exposures by rating.
2010
Notional:
protected
assets
£m
Fair value:
reference
protected
assets
£m
Gross
exposure
£m
Credit
valuation
adjustment
£m
Net
exposure
£m
AAA 213 212 1 — 1
Ato AA- 644 629 15 4 11
Non-investment grade 20,066 19,050 1,016 401 615
Unrated 4,165 3,953 212 85 127
25,088 23,844 1,244 490 754
2009
AAA 1,658 1,637 21 5 16
BBB- to A- 1,070 1,043 27 9 18
Non-investment grade 17,696 16,742 954 377 577
Unrated 3,926 3,653 273 108 165
24,350 23,075 1,275 499 776
2008
AAA 6,351 4,780 1,571 314 1,257
AA to AA+ 1,195 1,116 79 16 63
Ato AA- 13,092 10,891 2,201 657 1,544
BBB- to A- 4,601 3,676 925 324 601
25,239 20,463 4,776 1,311 3,465
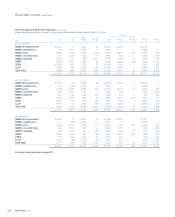
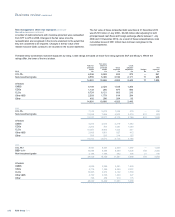
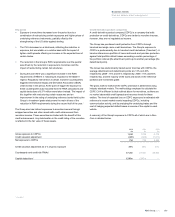
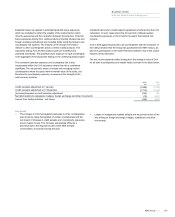
The table below details the net income statement effect arising from CDPC exposures.
2010 2009 2008
£m £m £m
Credit valuation adjustment at 1 January (499) (1,311) (44)
Credit valuation adjustment at 31 December (490) (499) (1,311)
Decrease/(increase) in credit valuation adjustment 9812 (1,267)
Net (debit)/credit relating to realisations, hedges, foreign exchange and other movements (150) (1,769) 652
Income from trading activities - net losses (141) (957) (615)
Key points
xLosses reduced significantly in 2010 due to smaller exposures and
reduced losses on hedges that were introduced to cap the
exposures.
xThe CVA decrease for the year reflected exposure reductions, due
to trade commutations, tighter credit spreads of the underlying
reference portfolios, partially offset by an increase in the relative
value of senior tranches compared with the underlying reference
portfolios and foreign currency movements.
xCounterparty and credit RWAs and capital deductions decreased in
line with the exposure.
xCertain CDPCs, where the Group has hedges in place to cap the
exposure, are excluded from the RWA calculations with capital
deduction taken instead.
Other counterparties
The CVA for all other counterparties is calculated on a portfolio basis
reflecting an estimate of the amount a third party would charge to assume
the credit risk.
Expected losses are determined from the market implied probability of
defaults and internally assessed recovery levels. The probability of
default is calculated with reference to observable credit spreads and
observable recovery levels. For counterparties where observable data do
not exist, the probability of default is determined from the average credit
spreads and recovery levels of baskets of similarly rated entities. A
weighting of 50% to 100% is applied to arrive at the CVA. The weighting
reflects portfolio churn and varies according to the counterparty credit
quality.
RBS Group 2010214
Business review continued