RBS 2010 Annual Report Download - page 173
Download and view the complete annual report
Please find page 173 of the 2010 RBS annual report below. You can navigate through the pages in the report by either clicking on the pages listed below, or by using the keyword search tool below to find specific information within the annual report.-
 1
1 -
2
-
3
-
4
-
5
-
6
-
7
-
8
-
9
-
10
-
11
-
12
-
13
-
14
-
15
-
16
-
17
-
18
-
19
-
20
-
21
-
22
-
23
-
24
-
25
-
26
-
27
-
28
-
29
-
30
-
31
-
32
-
33
-
34
-
35
-
36
-
37
-
38
-
39
-
40
-
41
-
42
-
43
-
44
-
45
-
46
-
47
-
48
-
49
-
50
-
51
-
52
-
53
-
54
-
55
-
56
-
57
-
58
-
59
-
60
-
61
-
62
-
63
-
64
-
65
-
66
-
67
-
68
-
69
-
70
-
71
-
72
-
73
-
74
-
75
-
76
-
77
-
78
-
79
-
80
-
81
-
82
-
83
-
84
-
85
-
86
-
87
-
88
-
89
-
90
-
91
-
92
-
93
-
94
-
95
-
96
-
97
-
98
-
99
-
100
-
101
-
102
-
103
-
104
-
105
-
106
-
107
-
108
-
109
-
110
-
111
-
112
-
113
-
114
-
115
-
116
-
117
-
118
-
119
-
120
-
121
-
122
-
123
-
124
-
125
-
126
-
127
-
128
-
129
-
130
-
131
-
132
-
133
-
134
-
135
-
136
-
137
-
138
-
139
-
140
-
141
-
142
-
143
-
144
-
145
-
146
-
147
-
148
-
149
-
150
-
151
-
152
-
153
-
154
-
155
-
156
-
157
-
158
-
159
-
160
-
161
-
162
-
 163
163 -
 164
164 -
 165
165 -
 166
166 -
 167
167 -
 168
168 -
 169
169 -
 170
170 -
 171
171 -
 172
172 -
 173
173 -
 174
174 -
 175
175 -
 176
176 -
 177
177 -
 178
178 -
 179
179 -
 180
180 -
 181
181 -
 182
182 -
 183
183 -
184
-
185
-
186
-
187
-
188
-
189
-
190
-
191
-
192
-
193
-
194
-
195
-
196
-
197
-
198
-
199
-
200
-
201
-
202
-
203
-
204
-
205
-
206
-
207
-
208
-
209
-
210
-
211
-
212
-
213
-
214
-
215
-
216
-
217
-
218
-
219
-
220
-
221
-
222
-
223
-
224
-
225
-
226
-
227
-
228
-
229
-
230
-
231
-
232
-
233
-
234
-
235
-
236
-
237
-
238
-
239
-
240
-
241
-
242
-
243
-
244
-
245
-
246
-
247
-
248
-
249
-
250
-
251
-
252
-
253
-
254
-
255
-
256
-
257
-
258
-
259
-
260
-
261
-
262
-
263
-
264
-
265
-
266
-
267
-
268
-
269
-
270
-
271
-
272
-
273
-
274
-
275
-
276
-
277
-
278
-
279
-
280
-
281
-
282
-
283
-
284
-
285
-
286
-
287
-
288
-
289
-
290
-
291
-
292
-
293
-
294
-
295
-
296
-
297
-
298
-
299
-
300
-
301
-
302
-
303
-
304
-
305
-
306
-
307
-
308
-
309
-
310
-
311
-
312
-
313
-
314
-
315
-
316
-
317
-
318
-
319
-
320
-
321
-
322
-
323
-
324
-
325
-
326
-
327
-
328
-
329
-
330
-
331
-
332
-
333
-
334
-
335
-
336
-
337
-
338
-
339
-
340
-
341
-
342
-
343
-
344
-
345
-
346
-
347
-
348
-
349
-
350
-
351
-
352
-
353
-
354
-
355
-
356
-
357
-
358
-
359
-
360
-
361
-
362
-
363
-
364
-
365
-
366
-
367
-
368
-
369
-
370
-
371
-
372
-
373
-
374
-
375
-
376
-
377
-
378
-
379
-
380
-
381
-
382
-
383
-
384
-
385
-
386
-
387
-
388
-
389
-
390
-
391
-
392
-
393
-
394
-
395
-
396
-
397
-
398
-
399
-
400
-
401
-
402
-
403
-
404
-
405
-
406
-
407
-
408
-
409
-
410
-
411
-
412
-
413
-
414
-
415
-
416
-
417
-
418
-
419
-
420
-
421
-
422
-
423
-
424
-
425
-
426
-
427
-
428
-
429
-
430
-
431
-
432
-
433
-
434
-
435
-
436
-
437
-
438
-
439
-
440
-
441
-
442
-
443
-
444
-
445
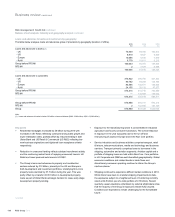
 |
 |

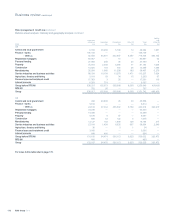
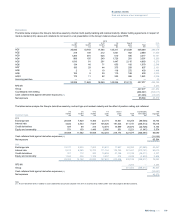
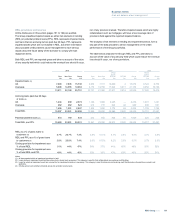
Loans and advances
Core Non-Core Total Securities Derivatives Other (1) Total
Netting
and
offset (2)
2009 £m £m £m £m £m £m £m £m
Europe
Central and local government 334 1,164 1,498 25,328 68 24 26,918 —
Finance - banks 4,906 528 5,434 — — — 5,434 —
- other (3) 4,161 1,028 5,189 22,913 1,699 43 29,844 —
Residential mortgages 15,055 6,718 21,773 — — — 21,773 —
Personal lending 1,877 1,009 2,886 — — 17 2,903 —
Property 10,812 9,417 20,229 1 17 4 20,251 —
Construction 1,946 1,167 3,113 1 1 1 3,116 —
Manufacturing 7,311 8,609 15,920 42 123 — 16,085 —
Service industries and business activities 19,088 9,895 28,983 331 88 51 29,453 —
Agriculture, forestry and fishing 737 356 1,093 1 — — 1,094 —
Finance lease and instalment credit 379 1,094 1,473 12 — — 1,485 —
Interest accruals 266 249 515 706 — — 1,221 —
Group before RFS MI 66,872 41,234 108,106 49,335 1,996 140 159,577 —
RFS MI 140,098 21,681 3,232 9 165,020 —
Group 248,204 71,016 5,228 149 324,597 —
RoW
Central and local government 1,376 28 1,404 13,201 169 36 14,810 —
Finance - banks 10,200 354 10,554 — — — 10,554 —
- other (3) 8,623 1,033 9,656 3,772 25,045 796 39,269 19,747
Residential mortgages 390 1 391 — — — 391 —
Personal lending 1,450 613 2,063 — 29 1 2,093 —
Property 337 1,780 2,117 679 51 — 2,847 —
Construction 102 319 421 188 23 — 632 —
Manufacturing 2,604 1,338 3,942 26 428 14 4,410 —
Service industries and business activities 4,527 3,385 7,912 589 757 1 9,259 1
Agriculture, forestry and fishing 16 59 75 — 3 — 78 —
Finance lease and instalment credit 819 27 — — — 27 —
Interest accruals 149 32 181 74 — — 255 —
Group before RFS MI 29,782 8,961 38,743 18,529 26,505 848 84,625 19,748
RFS MI 1,786 — 22 — 1,808 55
Group 40,529 18,529 26,527 848 86,433 19,803
For notes to this table refer to page 173.
171RBS Group 2010
Business review
Risk and balance sheet management