RBS 2010 Annual Report Download - page 369
Download and view the complete annual report
Please find page 369 of the 2010 RBS annual report below. You can navigate through the pages in the report by either clicking on the pages listed below, or by using the keyword search tool below to find specific information within the annual report.-
 1
1 -
2
-
3
-
4
-
5
-
6
-
7
-
8
-
9
-
10
-
11
-
12
-
13
-
14
-
15
-
16
-
17
-
18
-
19
-
20
-
21
-
22
-
23
-
24
-
25
-
26
-
27
-
28
-
29
-
30
-
31
-
32
-
33
-
34
-
35
-
36
-
37
-
38
-
39
-
40
-
41
-
42
-
43
-
44
-
45
-
46
-
47
-
48
-
49
-
50
-
51
-
52
-
53
-
54
-
55
-
56
-
57
-
58
-
59
-
60
-
61
-
62
-
63
-
64
-
65
-
66
-
67
-
68
-
69
-
70
-
71
-
72
-
73
-
74
-
75
-
76
-
77
-
78
-
79
-
80
-
81
-
82
-
83
-
84
-
85
-
86
-
87
-
88
-
89
-
90
-
91
-
92
-
93
-
94
-
95
-
96
-
97
-
98
-
99
-
100
-
101
-
102
-
103
-
104
-
105
-
106
-
107
-
108
-
109
-
110
-
111
-
112
-
113
-
114
-
115
-
116
-
117
-
118
-
119
-
120
-
121
-
122
-
123
-
124
-
125
-
126
-
127
-
128
-
129
-
130
-
131
-
132
-
133
-
134
-
135
-
136
-
137
-
138
-
139
-
140
-
141
-
142
-
143
-
144
-
145
-
146
-
147
-
148
-
149
-
150
-
151
-
152
-
153
-
154
-
155
-
156
-
157
-
158
-
159
-
160
-
161
-
162
-
163
-
164
-
165
-
166
-
167
-
168
-
169
-
170
-
171
-
172
-
173
-
174
-
175
-
176
-
177
-
178
-
179
-
180
-
181
-
182
-
183
-
184
-
185
-
186
-
187
-
188
-
189
-
190
-
191
-
192
-
193
-
194
-
195
-
196
-
197
-
198
-
199
-
200
-
201
-
202
-
203
-
204
-
205
-
206
-
207
-
208
-
209
-
210
-
211
-
212
-
213
-
214
-
215
-
216
-
217
-
218
-
219
-
220
-
221
-
222
-
223
-
224
-
225
-
226
-
227
-
228
-
229
-
230
-
231
-
232
-
233
-
234
-
235
-
236
-
237
-
238
-
239
-
240
-
241
-
242
-
243
-
244
-
245
-
246
-
247
-
248
-
249
-
250
-
251
-
252
-
253
-
254
-
255
-
256
-
257
-
258
-
259
-
260
-
261
-
262
-
263
-
264
-
265
-
266
-
267
-
268
-
269
-
270
-
271
-
272
-
273
-
274
-
275
-
276
-
277
-
278
-
279
-
280
-
281
-
282
-
283
-
284
-
285
-
286
-
287
-
288
-
289
-
290
-
291
-
292
-
293
-
294
-
295
-
296
-
297
-
298
-
299
-
300
-
301
-
302
-
303
-
304
-
305
-
306
-
307
-
308
-
309
-
310
-
311
-
312
-
313
-
314
-
315
-
316
-
317
-
318
-
319
-
320
-
321
-
322
-
323
-
324
-
325
-
326
-
327
-
328
-
329
-
330
-
331
-
332
-
333
-
334
-
335
-
336
-
337
-
338
-
339
-
340
-
341
-
342
-
343
-
344
-
345
-
346
-
347
-
348
-
349
-
350
-
351
-
352
-
353
-
354
-
355
-
356
-
357
-
358
-
 359
359 -
 360
360 -
 361
361 -
 362
362 -
 363
363 -
 364
364 -
 365
365 -
 366
366 -
 367
367 -
 368
368 -
 369
369 -
 370
370 -
 371
371 -
 372
372 -
 373
373 -
 374
374 -
 375
375 -
 376
376 -
 377
377 -
 378
378 -
 379
379 -
380
-
381
-
382
-
383
-
384
-
385
-
386
-
387
-
388
-
389
-
390
-
391
-
392
-
393
-
394
-
395
-
396
-
397
-
398
-
399
-
400
-
401
-
402
-
403
-
404
-
405
-
406
-
407
-
408
-
409
-
410
-
411
-
412
-
413
-
414
-
415
-
416
-
417
-
418
-
419
-
420
-
421
-
422
-
423
-
424
-
425
-
426
-
427
-
428
-
429
-
430
-
431
-
432
-
433
-
434
-
435
-
436
-
437
-
438
-
439
-
440
-
441
-
442
-
443
-
444
-
445
 |
 |

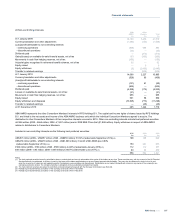
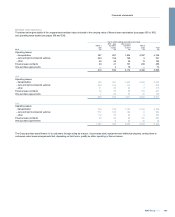
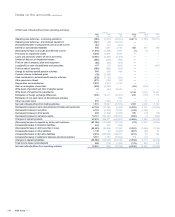
Contractual obligations for future expenditure not provided for in the accounts
The following table shows contractual obligations for future expenditure not provided for in the accounts at the year end.
Group
2010
£m
2009
£m
2008
£m
Operating leases
Minimum rentals payable under non-cancellable leases (1)
- within 1 year 497 479 579
- after 1 year but within 5 years 1,515 1,691 1,727
- after 5 years 2,892 3,055 3,299
4,904 5,225 5,605
Property, plant and equipment
Contracts to buy, enhance or maintain investment properties 2— 7
Contracts to buy assets to be leased under operating leases (2) 2,585 2,724 6,063
Other capital expenditure 150 89 128
2,737 2,813 6,198
Contracts to purchase goods or services (3) 397 665 2,127
8,038 8,703 13,930
Notes:
(1) Predominantly property leases.
(2) Of which due within 1 year: £263 million (2009 - £370 million; 2008 - £3,769 million).
(3) Of which due within 1 year: £283 million (2009 - £480 million; 2008 - £1,129 million).
Trustee and other fiduciary activities
In its capacity as trustee or other fiduciary role, the Group may hold or
place assets on behalf of individuals, trusts, companies, pension
schemes and others. The assets and their income are not included in the
Group's financial statements. The Group earned fee income of £629
million (2009 - £1,355 million; 2008 - £1,442 million) from these activities.
The Financial Services Compensation Scheme
The Financial Services Compensation Scheme (FSCS), the UK's
statutory fund of last resort for customers of authorised financial services
firms, pays compensation if a firm is unable to meet its obligations. The
FSCS funds compensation for customers by raising management
expenses levies and compensation levies on the industry. In relation to
protected deposits, each deposit-taking institution contributes towards
these levies in proportion to their share of total protected deposits on 31
December of the year preceding the scheme year (which runs from 1
April to 31 March), subject to annual maxima set by the Financial
Services Authority (FSA). In addition, the FSCS has the power to raise
levies (‘exit levies’) on firms who have ceased to participate in the
scheme and are in the process of ceasing to be authorised for the
amount that the firm would otherwise have been asked to pay during the
relevant levy year. The FSCS also has the power to raise exit levies on
such firms which look at their potential liability to pay levies in future
years.
The FSCS has borrowed from HM Treasury to fund the compensation
costs associated with Bradford & Bingley, Heritable Bank, Kaupthing
Singer & Friedlander, Landsbanki ‘Icesave’ and London Scottish Bank plc.
These borrowings are on an interest-only basis until 31 March 2012. The
annual limit on the FSCS interest and management expenses levy for the
period September 2008 to March 2012 in relation to these institutions has
been capped at £1 billion per annum.
The FSCS will receive funds from asset sales, surplus cash flow, or other
recoveries in relation to these institutions which will be used to reduce the
principal amount of the FSCS's borrowings. After the interest only period
aschedule for repayment of any outstanding borrowings will be agreed
between the FSCS and HM Treasury in the light of market conditions at
that time and the FSCS will begin to raise compensation levies (principal
repayments). No provision has been made for these levies as the amount
is not yet known.
The Group has accrued £144 million for its share of FSCS management
expenses levies for the 2010/11 and 2011/12 scheme years.
367RBS Group 2010
Financial statements