RBS 2010 Annual Report Download - page 214
Download and view the complete annual report
Please find page 214 of the 2010 RBS annual report below. You can navigate through the pages in the report by either clicking on the pages listed below, or by using the keyword search tool below to find specific information within the annual report.-
 1
1 -
2
-
3
-
4
-
5
-
6
-
7
-
8
-
9
-
10
-
11
-
12
-
13
-
14
-
15
-
16
-
17
-
18
-
19
-
20
-
21
-
22
-
23
-
24
-
25
-
26
-
27
-
28
-
29
-
30
-
31
-
32
-
33
-
34
-
35
-
36
-
37
-
38
-
39
-
40
-
41
-
42
-
43
-
44
-
45
-
46
-
47
-
48
-
49
-
50
-
51
-
52
-
53
-
54
-
55
-
56
-
57
-
58
-
59
-
60
-
61
-
62
-
63
-
64
-
65
-
66
-
67
-
68
-
69
-
70
-
71
-
72
-
73
-
74
-
75
-
76
-
77
-
78
-
79
-
80
-
81
-
82
-
83
-
84
-
85
-
86
-
87
-
88
-
89
-
90
-
91
-
92
-
93
-
94
-
95
-
96
-
97
-
98
-
99
-
100
-
101
-
102
-
103
-
104
-
105
-
106
-
107
-
108
-
109
-
110
-
111
-
112
-
113
-
114
-
115
-
116
-
117
-
118
-
119
-
120
-
121
-
122
-
123
-
124
-
125
-
126
-
127
-
128
-
129
-
130
-
131
-
132
-
133
-
134
-
135
-
136
-
137
-
138
-
139
-
140
-
141
-
142
-
143
-
144
-
145
-
146
-
147
-
148
-
149
-
150
-
151
-
152
-
153
-
154
-
155
-
156
-
157
-
158
-
159
-
160
-
161
-
162
-
163
-
164
-
165
-
166
-
167
-
168
-
169
-
170
-
171
-
172
-
173
-
174
-
175
-
176
-
177
-
178
-
179
-
180
-
181
-
182
-
183
-
184
-
185
-
186
-
187
-
188
-
189
-
190
-
191
-
192
-
193
-
194
-
195
-
196
-
197
-
198
-
199
-
200
-
201
-
202
-
203
-
 204
204 -
 205
205 -
 206
206 -
 207
207 -
 208
208 -
 209
209 -
 210
210 -
 211
211 -
 212
212 -
 213
213 -
 214
214 -
 215
215 -
 216
216 -
 217
217 -
 218
218 -
 219
219 -
 220
220 -
 221
221 -
 222
222 -
 223
223 -
 224
224 -
225
-
226
-
227
-
228
-
229
-
230
-
231
-
232
-
233
-
234
-
235
-
236
-
237
-
238
-
239
-
240
-
241
-
242
-
243
-
244
-
245
-
246
-
247
-
248
-
249
-
250
-
251
-
252
-
253
-
254
-
255
-
256
-
257
-
258
-
259
-
260
-
261
-
262
-
263
-
264
-
265
-
266
-
267
-
268
-
269
-
270
-
271
-
272
-
273
-
274
-
275
-
276
-
277
-
278
-
279
-
280
-
281
-
282
-
283
-
284
-
285
-
286
-
287
-
288
-
289
-
290
-
291
-
292
-
293
-
294
-
295
-
296
-
297
-
298
-
299
-
300
-
301
-
302
-
303
-
304
-
305
-
306
-
307
-
308
-
309
-
310
-
311
-
312
-
313
-
314
-
315
-
316
-
317
-
318
-
319
-
320
-
321
-
322
-
323
-
324
-
325
-
326
-
327
-
328
-
329
-
330
-
331
-
332
-
333
-
334
-
335
-
336
-
337
-
338
-
339
-
340
-
341
-
342
-
343
-
344
-
345
-
346
-
347
-
348
-
349
-
350
-
351
-
352
-
353
-
354
-
355
-
356
-
357
-
358
-
359
-
360
-
361
-
362
-
363
-
364
-
365
-
366
-
367
-
368
-
369
-
370
-
371
-
372
-
373
-
374
-
375
-
376
-
377
-
378
-
379
-
380
-
381
-
382
-
383
-
384
-
385
-
386
-
387
-
388
-
389
-
390
-
391
-
392
-
393
-
394
-
395
-
396
-
397
-
398
-
399
-
400
-
401
-
402
-
403
-
404
-
405
-
406
-
407
-
408
-
409
-
410
-
411
-
412
-
413
-
414
-
415
-
416
-
417
-
418
-
419
-
420
-
421
-
422
-
423
-
424
-
425
-
426
-
427
-
428
-
429
-
430
-
431
-
432
-
433
-
434
-
435
-
436
-
437
-
438
-
439
-
440
-
441
-
442
-
443
-
444
-
445
 |
 |

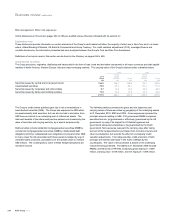
Risk management: Other risk exposures continued
Monoline insurers continued
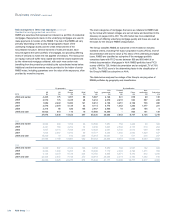
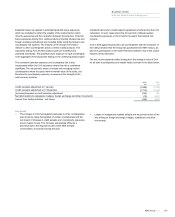
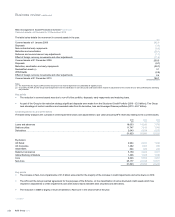
Anumber of debt instruments with monoline protection were reclassified
from HFT to AFS in 2008. Changes in the fair value since the
reclassification are recognised in the income statement to the extent that
they are considered to be impaired. Changes in the fair value of the
related monoline CDSs continue to be recorded in the income statement.
The fair value of these reclassified debt securities at 31 December 2010
was £5,572 million (1 July 2008 - £6,293 million after adjusting for both
principal based cash flows and foreign exchange effects between 1 July
2008 and 31 December 2010). As a result of these reclassifications, total
cumulative losses of £331 million have not been recognised in the
income statement.
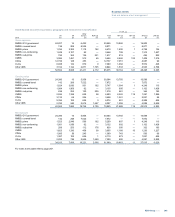
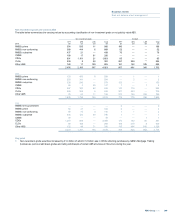
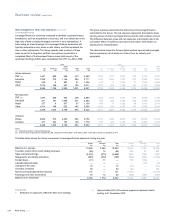
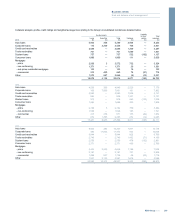
The table below summarises monoline exposures by rating. Credit ratings are based on those from rating agencies S&P and Moody's. Where the
ratings differ, the lower of the two is taken.
2010
Notional:
protected
assets
£m
Fair value:
reference
protected
assets
£m
Gross
exposure
£m
Credit
valuation
adjustment
£m
Hedges
£m
Net
exposure
£m
Ato AA- 6,336 5,503 833 272 — 561
Non-investment grade 8,555 5,365 3,190 2,171 71 948
14,891 10,868 4,023 2,443 71 1,509
Of which:
CMBS 4,149 2,424 1,725 1,253
CDOs 1,133 256 877 593
CLOs 6,724 6,121 603 210
Other ABS 2,393 1,779 614 294
Other 492 288 204 93
14,891 10,868 4,023 2,443
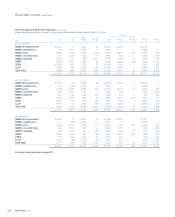
2009
Ato AA- 7,143 5,875 1,268 378 — 890
Non-investment grade 12,598 7,696 4,902 3,418 531 953
19,741 13,571 6,170 3,796 531 1,843
Of which:
CMBS 4,253 2,034 2,219 1,562
CDOs 2,284 797 1,487 1,059
CLOs 10,007 8,584 1,423 641
Other ABS 2,688 1,861 827 412
Other 509 295 214 122
19,741 13,571 6,170 3,796
2008
Ato AA+ 8,937 6,537 2,400 1,067 — 1,333
BBB- to A- 16,895 8,396 8,499 4,426 768 3,305
Non-investment grade 2,188 1,506 682 495 21 166
28,020 16,439 11,581 5,988 789 4,804
Of which:
CMBS 4,849 2,388 2,461 1,429
CDOs 5,779 1,395 4,384 2,201
CLOs 12,865 9,673 3,192 1,556
Other ABS 3,759 2,525 1,234 627
Other 768 458 310 175
28,020 16,439 11,581 5,988
RBS Group 2010212
Business review continued