RBS 2010 Annual Report Download - page 82
Download and view the complete annual report
Please find page 82 of the 2010 RBS annual report below. You can navigate through the pages in the report by either clicking on the pages listed below, or by using the keyword search tool below to find specific information within the annual report.-
 1
1 -
2
-
3
-
4
-
5
-
6
-
7
-
8
-
9
-
10
-
11
-
12
-
13
-
14
-
15
-
16
-
17
-
18
-
19
-
20
-
21
-
22
-
23
-
24
-
25
-
26
-
27
-
28
-
29
-
30
-
31
-
32
-
33
-
34
-
35
-
36
-
37
-
38
-
39
-
40
-
41
-
42
-
43
-
44
-
45
-
46
-
47
-
48
-
49
-
50
-
51
-
52
-
53
-
54
-
55
-
56
-
57
-
58
-
59
-
60
-
61
-
62
-
63
-
64
-
65
-
66
-
67
-
68
-
69
-
70
-
71
-
 72
72 -
 73
73 -
 74
74 -
 75
75 -
 76
76 -
 77
77 -
 78
78 -
 79
79 -
 80
80 -
 81
81 -
 82
82 -
 83
83 -
 84
84 -
 85
85 -
 86
86 -
 87
87 -
 88
88 -
 89
89 -
 90
90 -
 91
91 -
 92
92 -
93
-
94
-
95
-
96
-
97
-
98
-
99
-
100
-
101
-
102
-
103
-
104
-
105
-
106
-
107
-
108
-
109
-
110
-
111
-
112
-
113
-
114
-
115
-
116
-
117
-
118
-
119
-
120
-
121
-
122
-
123
-
124
-
125
-
126
-
127
-
128
-
129
-
130
-
131
-
132
-
133
-
134
-
135
-
136
-
137
-
138
-
139
-
140
-
141
-
142
-
143
-
144
-
145
-
146
-
147
-
148
-
149
-
150
-
151
-
152
-
153
-
154
-
155
-
156
-
157
-
158
-
159
-
160
-
161
-
162
-
163
-
164
-
165
-
166
-
167
-
168
-
169
-
170
-
171
-
172
-
173
-
174
-
175
-
176
-
177
-
178
-
179
-
180
-
181
-
182
-
183
-
184
-
185
-
186
-
187
-
188
-
189
-
190
-
191
-
192
-
193
-
194
-
195
-
196
-
197
-
198
-
199
-
200
-
201
-
202
-
203
-
204
-
205
-
206
-
207
-
208
-
209
-
210
-
211
-
212
-
213
-
214
-
215
-
216
-
217
-
218
-
219
-
220
-
221
-
222
-
223
-
224
-
225
-
226
-
227
-
228
-
229
-
230
-
231
-
232
-
233
-
234
-
235
-
236
-
237
-
238
-
239
-
240
-
241
-
242
-
243
-
244
-
245
-
246
-
247
-
248
-
249
-
250
-
251
-
252
-
253
-
254
-
255
-
256
-
257
-
258
-
259
-
260
-
261
-
262
-
263
-
264
-
265
-
266
-
267
-
268
-
269
-
270
-
271
-
272
-
273
-
274
-
275
-
276
-
277
-
278
-
279
-
280
-
281
-
282
-
283
-
284
-
285
-
286
-
287
-
288
-
289
-
290
-
291
-
292
-
293
-
294
-
295
-
296
-
297
-
298
-
299
-
300
-
301
-
302
-
303
-
304
-
305
-
306
-
307
-
308
-
309
-
310
-
311
-
312
-
313
-
314
-
315
-
316
-
317
-
318
-
319
-
320
-
321
-
322
-
323
-
324
-
325
-
326
-
327
-
328
-
329
-
330
-
331
-
332
-
333
-
334
-
335
-
336
-
337
-
338
-
339
-
340
-
341
-
342
-
343
-
344
-
345
-
346
-
347
-
348
-
349
-
350
-
351
-
352
-
353
-
354
-
355
-
356
-
357
-
358
-
359
-
360
-
361
-
362
-
363
-
364
-
365
-
366
-
367
-
368
-
369
-
370
-
371
-
372
-
373
-
374
-
375
-
376
-
377
-
378
-
379
-
380
-
381
-
382
-
383
-
384
-
385
-
386
-
387
-
388
-
389
-
390
-
391
-
392
-
393
-
394
-
395
-
396
-
397
-
398
-
399
-
400
-
401
-
402
-
403
-
404
-
405
-
406
-
407
-
408
-
409
-
410
-
411
-
412
-
413
-
414
-
415
-
416
-
417
-
418
-
419
-
420
-
421
-
422
-
423
-
424
-
425
-
426
-
427
-
428
-
429
-
430
-
431
-
432
-
433
-
434
-
435
-
436
-
437
-
438
-
439
-
440
-
441
-
442
-
443
-
444
-
445
 |
 |

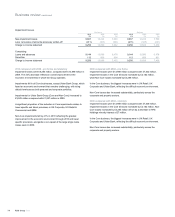
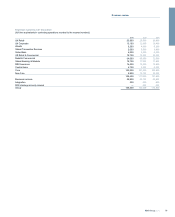
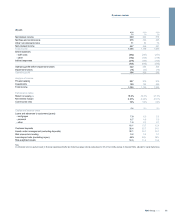
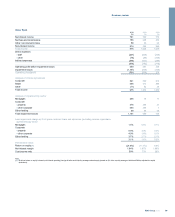
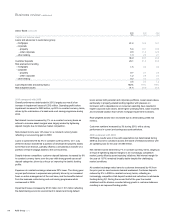
UK Retail
2010 2009 2008
£m £m £m
Net interest income 4,078 3,452 3,187
Net fees and commissions 1,100 1,244 1,524
Other non-interest income (net of insurance claims) 227 251 227
Non-interest income 1,327 1,495 1,751
Total income 5,405 4,947 4,938
Direct expenses
-staff costs (778) (845) (924)
- other (474) (453) (548)
Indirect expenses (1,621) (1,741) (1,724)
(2,873) (3,039) (3,196)
Operating profit before impairment losses 2,532 1,908 1,742
Impairment losses (1,160) (1,679) (1,019)
Operating profit 1,372 229 723
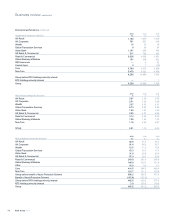
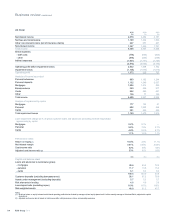
Analysis of income by product
Personal advances 993 1,192 1,244
Personal deposits 1,102 1,349 2,037
Mortgages 1,984 1,214 500
Bancassurance 229 246 217
Cards 962 869 831
Other 135 77 109
Total income 5,405 4,947 4,938
Analysis of impairment by sector
Mortgages 177 124 31
Personal 682 1,023 568
Cards 301 532 420
Total impairment losses 1,160 1,679 1,019
Loan impairment charge as % of gross customer loans and advances (excluding reverse repurchase
agreements) by sector
Mortgages 0.2% 0.1% —
Personal 5.8% 7.5% 3.7%
Cards 4.9% 8.6% 6.7%
1.1% 1.6% 1.1%
Performance ratios
Return on equity (1) 18.0% 3.0% 11.1%
Net interest margin 3.91% 3.59% 3.58%
Cost:income ratio 52% 60% 62%
Adjusted cost:income ratio (2) 53% 61% 65%
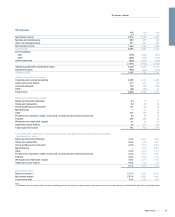
£bn £bn £bn
Capital and balance sheet
Loans and advances to customers (gross)
- mortgages 90.6 83.2 72.2
- personal 11.7 13.6 15.3
- cards 6.1 6.2 6.3
108.4 103.0 93.8
Customer deposits (excluding bancassurance) 96.1 87.2 78.9
Assets under management (excluding deposits) 5.7 5.3 5.7
Risk elements in lending 4.6 4.6 3.8
Loan:deposit ratio (excluding repos) 110% 115% 116%
Risk-weighted assets 48.8 51.3 45.7
Notes:
(1) Divisional return on equity is based on divisional operating profit after tax divided by average notional equity (based on 9% of the monthly average of divisional RWAs, adjusted for capital
deductions).
(2) Adjusted cost:income ratio is based on total income after netting insurance claims, and operating expenses.
RBS Group 201080
Business review continued