RBS 2010 Annual Report Download - page 274
Download and view the complete annual report
Please find page 274 of the 2010 RBS annual report below. You can navigate through the pages in the report by either clicking on the pages listed below, or by using the keyword search tool below to find specific information within the annual report.-
 1
1 -
2
-
3
-
4
-
5
-
6
-
7
-
8
-
9
-
10
-
11
-
12
-
13
-
14
-
15
-
16
-
17
-
18
-
19
-
20
-
21
-
22
-
23
-
24
-
25
-
26
-
27
-
28
-
29
-
30
-
31
-
32
-
33
-
34
-
35
-
36
-
37
-
38
-
39
-
40
-
41
-
42
-
43
-
44
-
45
-
46
-
47
-
48
-
49
-
50
-
51
-
52
-
53
-
54
-
55
-
56
-
57
-
58
-
59
-
60
-
61
-
62
-
63
-
64
-
65
-
66
-
67
-
68
-
69
-
70
-
71
-
72
-
73
-
74
-
75
-
76
-
77
-
78
-
79
-
80
-
81
-
82
-
83
-
84
-
85
-
86
-
87
-
88
-
89
-
90
-
91
-
92
-
93
-
94
-
95
-
96
-
97
-
98
-
99
-
100
-
101
-
102
-
103
-
104
-
105
-
106
-
107
-
108
-
109
-
110
-
111
-
112
-
113
-
114
-
115
-
116
-
117
-
118
-
119
-
120
-
121
-
122
-
123
-
124
-
125
-
126
-
127
-
128
-
129
-
130
-
131
-
132
-
133
-
134
-
135
-
136
-
137
-
138
-
139
-
140
-
141
-
142
-
143
-
144
-
145
-
146
-
147
-
148
-
149
-
150
-
151
-
152
-
153
-
154
-
155
-
156
-
157
-
158
-
159
-
160
-
161
-
162
-
163
-
164
-
165
-
166
-
167
-
168
-
169
-
170
-
171
-
172
-
173
-
174
-
175
-
176
-
177
-
178
-
179
-
180
-
181
-
182
-
183
-
184
-
185
-
186
-
187
-
188
-
189
-
190
-
191
-
192
-
193
-
194
-
195
-
196
-
197
-
198
-
199
-
200
-
201
-
202
-
203
-
204
-
205
-
206
-
207
-
208
-
209
-
210
-
211
-
212
-
213
-
214
-
215
-
216
-
217
-
218
-
219
-
220
-
221
-
222
-
223
-
224
-
225
-
226
-
227
-
228
-
229
-
230
-
231
-
232
-
233
-
234
-
235
-
236
-
237
-
238
-
239
-
240
-
241
-
242
-
243
-
244
-
245
-
246
-
247
-
248
-
249
-
250
-
251
-
252
-
253
-
254
-
255
-
256
-
257
-
258
-
259
-
260
-
261
-
262
-
263
-
 264
264 -
 265
265 -
 266
266 -
 267
267 -
 268
268 -
 269
269 -
 270
270 -
 271
271 -
 272
272 -
 273
273 -
 274
274 -
 275
275 -
 276
276 -
 277
277 -
 278
278 -
 279
279 -
 280
280 -
 281
281 -
 282
282 -
 283
283 -
 284
284 -
285
-
286
-
287
-
288
-
289
-
290
-
291
-
292
-
293
-
294
-
295
-
296
-
297
-
298
-
299
-
300
-
301
-
302
-
303
-
304
-
305
-
306
-
307
-
308
-
309
-
310
-
311
-
312
-
313
-
314
-
315
-
316
-
317
-
318
-
319
-
320
-
321
-
322
-
323
-
324
-
325
-
326
-
327
-
328
-
329
-
330
-
331
-
332
-
333
-
334
-
335
-
336
-
337
-
338
-
339
-
340
-
341
-
342
-
343
-
344
-
345
-
346
-
347
-
348
-
349
-
350
-
351
-
352
-
353
-
354
-
355
-
356
-
357
-
358
-
359
-
360
-
361
-
362
-
363
-
364
-
365
-
366
-
367
-
368
-
369
-
370
-
371
-
372
-
373
-
374
-
375
-
376
-
377
-
378
-
379
-
380
-
381
-
382
-
383
-
384
-
385
-
386
-
387
-
388
-
389
-
390
-
391
-
392
-
393
-
394
-
395
-
396
-
397
-
398
-
399
-
400
-
401
-
402
-
403
-
404
-
405
-
406
-
407
-
408
-
409
-
410
-
411
-
412
-
413
-
414
-
415
-
416
-
417
-
418
-
419
-
420
-
421
-
422
-
423
-
424
-
425
-
426
-
427
-
428
-
429
-
430
-
431
-
432
-
433
-
434
-
435
-
436
-
437
-
438
-
439
-
440
-
441
-
442
-
443
-
444
-
445
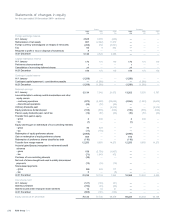
 |
 |

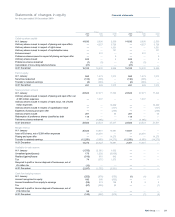
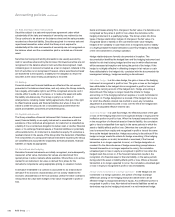
Group Company
2010 2009 2008 2010 2009 2008
£m £m £m £m £m £m
Foreign exchange reserve
At 1 January 4,528 6,385 (426) ———
Retranslation of net assets 997 (2,322) 11,970 ———
Foreign currency (losses)/gains on hedges of net assets (458) 456 (5,801) ———
Tax 63 9 642 ———
Recycled to profit or loss on disposal of businesses 8— — ———
At 31 December 5,138 4,528 6,385 ———
Capital redemption reserve
At 1 January 170 170 170 170 170 170
Preference shares redeemed 1— — 1——
Cancellation of non-voting deferred shares 27 — — 27 ——
At 31 December 198 170 170 198 170 170
Contingent capital reserve
At 1 January (1,208) — — (1,208) ——
Contingent capital agreement - consideration payable —(1,208) — —(1,208) —
At 31 December (1,208) (1,208) — (1,208) (1,208) —
Retained earnings
At 1 January 12,134 7,542 21,072 13,262 5,550 3,787
Loss attributable to ordinary and B shareholders and other
equity owners
-continuing operations (973) (2,600) (23,624) (4,554) (1,503) (9,602)
- discontinued operations (28) (72) (86) ———
Ordinary dividends paid —— (2,312) —— (2,312)
Equity preference dividends paid (105) (878) (536) (105) (878) (536)
Paid-in equity dividends paid, net of tax (19) (57) (60) (19) (57) (60)
Transfer from paid-in equity
-gross 2200 — 2200 —
- tax (1) — — (1) ——
Equity owners gain on withdrawal of non-controlling interests
-gross 40 629 — ———
- tax (11) (176) — ———
Redemption of equity preference shares (2,968) — — (2,968) ——
Gain on redemption of equity preference shares 609 — — 616 ——
Redemption of preference shares classified as debt (118) — — (118) ——
Transfer from merger reserve 12,250 9,950 14,273 12,250 9,950 14,273
Actuarial gains/(losses) recognised in retirement benefit
schemes
-gross 158 (3,756) (1,807) ———
- tax (71) 1,043 472 ———
Purchase of non-controlling interests (38) — — ———
Net cost of shares bought and used to satisfy share-based
payments (13) (16) (19) ———
Share-based payments
-gross 385 325 177 ———
- tax 6— (8) ———
At 31 December 21,239 12,134 7,542 18,365 13,262 5,550
Own shares held
At 1 January (121) (104) (61) ———
Shares purchased (700) (33) (64) ———
Shares issued under employee share schemes 13 16 21 ———
At 31 December (808) (121) (104) ———
Equity owners at 31 December 75,132 77,736 58,879 59,224 65,582 44,158
RBS Group 2010272
Statements of changes in equity
for the year ended 31 December 2010 continued