RBS 2013 Annual Report Download
Download and view the complete annual report
Please find the complete 2013 RBS annual report below. You can navigate through the pages in the report by either clicking on the pages listed below, or by using the keyword search tool below to find specific information within the annual report.-
 1
1 -
 2
2 -
 3
3 -
 4
4 -
 5
5 -
 6
6 -
 7
7 -
 8
8 -
 9
9 -
 10
10 -
 11
11 -
 12
12 -
13
-
14
-
15
-
16
-
17
-
18
-
19
-
20
-
21
-
22
-
23
-
24
-
25
-
26
-
27
-
28
-
29
-
30
-
31
-
32
-
33
-
34
-
35
-
36
-
37
-
38
-
39
-
40
-
41
-
42
-
43
-
44
-
45
-
46
-
47
-
48
-
49
-
50
-
51
-
52
-
53
-
54
-
55
-
56
-
57
-
58
-
59
-
60
-
61
-
62
-
63
-
64
-
65
-
66
-
67
-
68
-
69
-
70
-
71
-
72
-
73
-
74
-
75
-
76
-
77
-
78
-
79
-
80
-
81
-
82
-
83
-
84
-
85
-
86
-
87
-
88
-
89
-
90
-
91
-
92
-
93
-
94
-
95
-
96
-
97
-
98
-
99
-
100
-
101
-
102
-
103
-
104
-
105
-
106
-
107
-
108
-
109
-
110
-
111
-
112
-
113
-
114
-
115
-
116
-
117
-
118
-
119
-
120
-
121
-
122
-
123
-
124
-
125
-
126
-
127
-
128
-
129
-
130
-
131
-
132
-
133
-
134
-
135
-
136
-
137
-
138
-
139
-
140
-
141
-
142
-
143
-
144
-
145
-
146
-
147
-
148
-
149
-
150
-
151
-
152
-
153
-
154
-
155
-
156
-
157
-
158
-
159
-
160
-
161
-
162
-
163
-
164
-
165
-
166
-
167
-
168
-
169
-
170
-
171
-
172
-
173
-
174
-
175
-
176
-
177
-
178
-
179
-
180
-
181
-
182
-
183
-
184
-
185
-
186
-
187
-
188
-
189
-
190
-
191
-
192
-
193
-
194
-
195
-
196
-
197
-
198
-
199
-
200
-
201
-
202
-
203
-
204
-
205
-
206
-
207
-
208
-
209
-
210
-
211
-
212
-
213
-
214
-
215
-
216
-
217
-
218
-
219
-
220
-
221
-
222
-
223
-
224
-
225
-
226
-
227
-
228
-
229
-
230
-
231
-
232
-
233
-
234
-
235
-
236
-
237
-
238
-
239
-
240
-
241
-
242
-
243
-
244
-
245
-
246
-
247
-
248
-
249
-
250
-
251
-
252
-
253
-
254
-
255
-
256
-
257
-
258
-
259
-
260
-
261
-
262
-
263
-
264
-
265
-
266
-
267
-
268
-
269
-
270
-
271
-
272
-
273
-
274
-
275
-
276
-
277
-
278
-
279
-
280
-
281
-
282
-
283
-
284
-
285
-
286
-
287
-
288
-
289
-
290
-
291
-
292
-
293
-
294
-
295
-
296
-
297
-
298
-
299
-
300
-
301
-
302
-
303
-
304
-
305
-
306
-
307
-
308
-
309
-
310
-
311
-
312
-
313
-
314
-
315
-
316
-
317
-
318
-
319
-
320
-
321
-
322
-
323
-
324
-
325
-
326
-
327
-
328
-
329
-
330
-
331
-
332
-
333
-
334
-
335
-
336
-
337
-
338
-
339
-
340
-
341
-
342
-
343
-
344
-
345
-
346
-
347
-
348
-
349
-
350
-
351
-
352
-
353
-
354
-
355
-
356
-
357
-
358
-
359
-
360
-
361
-
362
-
363
-
364
-
365
-
366
-
367
-
368
-
369
-
370
-
371
-
372
-
373
-
374
-
375
-
376
-
377
-
378
-
379
-
380
-
381
-
382
-
383
-
384
-
385
-
386
-
387
-
388
-
389
-
390
-
391
-
392
-
393
-
394
-
395
-
396
-
397
-
398
-
399
-
400
-
401
-
402
-
403
-
404
-
405
-
406
-
407
-
408
-
409
-
410
-
411
-
412
-
413
-
414
-
415
-
416
-
417
-
418
-
419
-
420
-
421
-
422
-
423
-
424
-
425
-
426
-
427
-
428
-
429
-
430
-
431
-
432
-
433
-
434
-
435
-
436
-
437
-
438
-
439
-
440
-
441
-
442
-
443
-
444
-
445
-
446
-
447
-
448
-
449
-
450
-
451
-
452
-
453
-
454
-
455
-
456
-
457
-
458
-
459
-
460
-
461
-
462
-
463
-
464
-
465
-
466
-
467
-
468
-
469
-
470
-
471
-
472
-
473
-
474
-
475
-
476
-
477
-
478
-
479
-
480
-
481
-
482
-
483
-
484
-
485
-
486
-
487
-
488
-
489
-
490
-
491
-
492
-
493
-
494
-
495
-
496
-
497
-
498
-
499
-
500
-
501
-
502
-
503
-
504
-
505
-
506
-
507
-
508
-
509
-
510
-
511
-
512
-
513
-
514
-
515
-
516
-
517
-
518
-
519
-
520
-
521
-
522
-
523
-
524
-
525
-
526
-
527
-
528
-
529
-
530
-
531
-
532
-
533
-
534
-
535
-
536
-
537
-
538
-
539
-
540
-
541
-
542
-
543
-
544
-
545
-
546
-
547
-
548
-
549
-
550
-
551
-
552
-
553
-
554
-
555
-
556
-
557
-
558
-
559
-
560
-
561
-
562
-
563
-
564
 |
 |

Serve customers well.
This is our purpose.
rbs.com
Annual Report and Accounts 2013
Table of contents
-
Page 1
Annual Report and Accounts 2013 Serve customers well. This is our purpose. rbs.com -
Page 2
... wide range of products and services to personal, commercial and large corporate and institutional customers through its two main subsidiaries, The Royal Bank of Scotland and NatWest, as well as through a number of other well-known brands including Citizens, Charter One, Ulster Bank and Coutts. Why... -
Page 3
... Report 2013 Financial Results Our purpose and values Our business model and strategy RBS at a glance UK Retail UK Corporate Wealth International Banking Ulster Bank US Retail & Commercial Markets Non-Core Business Services Governance at a glance Chairman's statement Chief Executive's review... -
Page 4
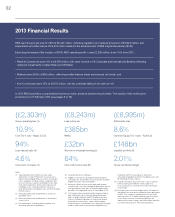
... Tier 1 ratio - FLB lll (3) 94% Loan:deposit ratio (4) £32bn Short-term wholesale funding (5) £146bn Liquidity portfolio (6) 4.6% Core return on equity (7) Notes: (1) Operating proï¬t/(loss) before tax, own credit adjustments, Payment Protection Insurance costs, Interest Rate Hedging Products... -
Page 5
...income in UK Corporate and International Banking offsetting improved impairments in Ulster Bank and UK Retail. Markets operating proï¬t, excluding £18 million of impairments related to the creation of RCR, was down 58% to £638 million, reï¬,ecting its smaller balance sheet and reduced risk levels... -
Page 6
... RBS held 28.5% of Direct Line Insurance Group. On 26 February 2014, RBS announced that it had entered into a placing agreement to complete the sale of its residual interest (except for 4.2 million shares held to satisfy long term incentive plan awards granted by RBS to Direct Line Group management... -
Page 7
... of new facilities were made available to new and existing clients. RBS also helped UK companies, universities and housing associations to raise £24.7 billion through bond issues in 2013. RBS repaid all its borrowings from the Bank of England Funding for Lending Scheme (FLS) in 2013 but continues... -
Page 8
... customers, shareholders and communities. Our values: Serving customers We exist to serve customers. We earn their trust by focusing on their needs and delivering excellent service. Working together We care for each other and work best as one team. We bring the best of ourselves to work and support... -
Page 9
... customers well, and work to fully embed our values in everything we do. Our employees believe in the goals of RBS and already 1 in 2 people have seen a change in how their team works. More information on our progress in 2013 to build an engaged and inclusive workforce will be available in our RBS... -
Page 10
... our debt securities we have issued. We also earn fees from ï¬nancial services and other products we provide to our customers as well as rental income from assets we lease to our customers. Our Markets business earns income from client driven trading activities particularly Rates, Currencies, Asset... -
Page 11
... 2013 RBS announced a full review of its customer-facing businesses, its IT and operations, and its organisational and decision-making structures. As a result of this review, we have announced a refreshed strategic direction with the ambition of building a bank that earns its customers' trust... -
Page 12
... Key Measures Value drivers Return on equity (1) Cost:income ratio Risk measures Core Tier 1 ratio Loan:deposit ratio Short-term wholesale funding (STWF) Liquidity portfolio (7) Leverage ratio (8) 4% (4) 154% (5) £297bn (6) £90bn (6) 28.7x (9) (31%) (2) 97% (3) Worst point 2012 Core 8.9% 59% Group... -
Page 13
... RBS a really good bank demands more. That is why we are still investing more effort in all of our businesses to serve customers well. RoW 4% Centre 1% UK Retail 25% Europe 9% Markets 17% USA 24% Total income by region 2013 UK 63% US Retail & Commercial 15% Ulster Bank 4% International Banking... -
Page 14
... 2013. • Customer deposits increased by 7%, above UK market average. • Net interest margin held steady, despite tightening margins on new mortgages. Lower income was earned on current account balances, but savings margins improved. Building a better bank that serves customers well In March 2013... -
Page 15
... cost of repairs and replacement stock while businesses wait for insurance claims to be paid. UK Corporate Chris Sullivan Chief Executive Performance highlights Return on equity (%) Cost:income ratio (%) Loan:deposit ratio (%) Risk-weighted assets (£bn) 2013 7.9 50 80 86.1 2012 14.5 44 82 86.3 23... -
Page 16
... value of our inter-connected world. Wealth Rory Tapner Chief Executive Performance highlights Return on equity (%) Cost:income ratio (%) Loan:deposit ratio (%) 2013 12.0 77 45 12.0 2012 13.1 75 44 12.3 6% Risk-weighted assets (£bn) Contribution to Core income Performance overview • Operating... -
Page 17
...and communication, the changes were successful. TomTom now has one, single payment process for suppliers across the world. International Banking John Owen Chief Executive Performance highlights Return on equity (%) Cost:income ratio (%) Loan:deposit ratio (%) Risk-weighted assets (£bn) 2013 3.9 73... -
Page 18
..., creating much-needed new homes as well as hundreds of construction jobs. Ulster Bank Jim Brown Chief Executive Performance highlights Return on equity (%) Cost:income ratio (%) Loan:deposit ratio (%) 2013 (32.4) 64 120 30.7 2012 (21.8) 62 130 36.1 4% Risk-weighted assets (£bn) Contribution to... -
Page 19
...efï¬ciency and security for our customers. US Retail & Commercial Bruce Van Saun Chief Executive, RBS Citizens and Head of RBS Americas Performance highlights Return on equity (%) (1) Cost:income ratio (%) (1) Loan:deposit ratio (%) Risk-weighted assets (£bn) 2013 7.2 73 91 56.1 2012 8.9 71 86 56... -
Page 20
...income in 2013 compared with 2012 reï¬,ected both the strategic scaling back of the balance sheet and risk reduction in a difï¬cult market environment with client activity limited by uncertainty over monetary policy in the US. For further information see page We provide ï¬nancing, risk management... -
Page 21
... different criteria and are not directly comparable. For further information see page 154 Business Services Simon McNamara Group Chief Administrative Ofï¬cer • We issued two million time-saving contactless cards in 2013 allowing customers to make quick and easy payments for everyday items under... -
Page 22
... and operating performance. The Board fully supports our new values, which were launched in 2013 and focus on serving customers, working together, doing the right thing and thinking long term. It is vital that the Board continues to set the tone from the top to drive essential cultural change and... -
Page 23
... full committee report on pages 64 and 65. Executive Committee Supports the Group Chief Executive in managing the Group's businesses. It reviews strategic issues and initiatives, monitors ï¬nancial performance and capital allocations and considers risk strategy, policy and management. RBS Capital... -
Page 24
... down as Group Chief Executive. We selected Ross McEwan to re-energise the task of building a bank that earns its customers' trust, improves operating efï¬ciency and can move down the path back to full private ownership. The Board and I want to thank Stephen Hester for his dedication to RBS and to... -
Page 25
... trusted bank we aspire to be. The Board fully supports the new values we launched in 2013, and it is vital that we continue to set the tone from the top in the coming year to drive essential cultural change. On many of these issues we have engaged closely with HM Treasury (HMT) through UK Financial... -
Page 26
..., and where we can serve their needs better than anyone else." Chief Executive's review Ross McEwan Chief Executive Since 2009 RBS has cleaned up the world's largest bank balance sheet by removing more than £1 trillion in assets. This was a remarkable achievement, born of absolute necessity, but... -
Page 27
... ï¬nancial services group when in fact we are now largely a UK-based bank. Our operating model means our customers and shareholders end up paying for parts of the business that cost too much and deliver too little in their interests. This needs to change. RBS needs a strategy that will address the... -
Page 28
... every business in our current structure will be best placed to deliver on our strategy. Technology investment will enable some to improve service at a rate that outpaces the market, but others will not. For those activities where we can't see a clear path to being number one, we will review on the... -
Page 29
Chief Executive's review 27 announced our intention to remove £9 billion of the worst credit risks from the Ulster Bank balance sheet. Our second step is focused on improving customer experience and shareholder return. As outlined in November, we are reviewing our business to make it viable and ... -
Page 30
... Bank Rate remained at 0.5%, although market rates increased towards the end of the year on expectations of tighter monetary policy in the United States. There were no additions to the stock of assets purchased through the quantitative easing programme. In August 2013, the Monetary Policy Committee... -
Page 31
... the bank, and the Group continued to suffer from legacy conduct issues during 2013, notably in relation to PPI, Interest Rate Hedging Products and mortgage-backed and other securities litigation. During the year, the Group focused on embedding good conduct at the heart of its business, working to... -
Page 32
... Financial Group, in particular, are cornerstones of this capital strategy. Top and emerging risk scenarios RBS identiï¬es and monitors its top and emerging risk scenarios. A number attracted particular attention from senior management during 2013 which are discussed below. For further information... -
Page 33
..., and attended by senior representatives from the customer facing divisions as well as Human Resources, Sustainability, Risk Management, Communications, Legal, Strategy and Corporate Services. The Chairman of the board also regularly attends the meetings. The work of the Committee is essential to... -
Page 34
..., achieving our best ever score in 2013. The Index ranks companies' corporate sustainability performance, based on analysis of economic, environmental and social issues like corporate governance, risk management, branding and climate change. The CDP is an independent, investor-driven organisation... -
Page 35
... operations. We have adopted and contributed to a number of internationally accepted codes, notably the Equator Principles and the UN Global Compact, which speciï¬cally address the management of human rights issues. The RBS Group Code of Conduct sets out the standards we expect our people to work... -
Page 36
34 Approval of Strategic Report The Strategic Report for the year ended 31 December 2013 set out on pages 1 to 33 was approved by the Board of directors on 26 February 2014. By order of the Board. Aileen Taylor Secretary 26 February 2014 Chairman Philip Hampton Executive directors Ross McEwan ... -
Page 37
... the Chairman Our governance structure Our Board Executive Committee Corporate governance Report of the Group Nominations Committee Report of the Group Audit Committee Report of the Board Risk Committee Report of the Group Sustainability Committee Directors' Remuneration Report Other Remuneration... -
Page 38
... search, Stephen was succeeded by Ross McEwan on 1 October 2013 and Ross now has his sights firmly set on building a bank focused on our customers and shareholders. Also on 1 October 2013, Bruce Van Saun took up his new role as Chairman and Chief Executive of RBS Citizens Financial Group, Inc... -
Page 39
... Board also received support from the Group Secretary in a number of other areas related to board effectiveness such as Board process and information flows, continuing professional development and induction for new directors. Corporate governance This is the first year that we are required to report... -
Page 40
...governance structure RBS Capital Resolution Board Oversight Committee Group Board The main decision making forum at Group level, setting the strategic direction of the Group and ensuring that the Group manages risk effectively. The Board is accountable to shareholders for financial and operational... -
Page 41
... Group Executive for Retail Banking Services and Executive General Manager responsible for the branch network, contact centres and third party mortgage brokers at Commonwealth Bank of Australia, Managing Director of stockbroking business First NZ Capital Securities, and Chief Executive of National... -
Page 42
...chief executive of Standard Life plc. He was also previously a director of the Association of British Insurers, a member of the former Chancellor of the Exchequer's High Level Group on Financial Services and Chairman of the Edinburgh World City of Literature Trust. In 2007 he was the Prince of Wales... -
Page 43
... as a Durham chartered accountant. He then moved into banking • Chairman of the Somerset House Trust joining SG Warburg, specialising in corporate finance, • Chairman of the Boat Race Company and was appointed as Co-Head and Managing Director Limited of its US investment banking business in 1989... -
Page 44
...services and risk management, including previous Committee membership(s): responsibility for Aviva's continental European and • Board Risk Committee (Chair) International life and long-term savings businesses. He • RCR Board Oversight Committee (Chair) held a number of senior executive positions... -
Page 45
... interest rate products, foreign exchange, asset backed securities, emerging markets, credit fixed income and debt capital markets. In this capacity, he oversees businesses which provide financing, risk management and advisory services to major corporations, financial institutions and public sector... -
Page 46
... Chief Executive Officer of RBS Citizens Financial Group, Inc. and Head of RBS Americas in October 2013. Prior to taking up his current role, Bruce was Group Finance Director and a director of the Company, RBS and NatWest having been appointed to those positions in 2009. Bruce has more than 30 years... -
Page 47
...of reference include key aspects of the company's affairs reserved for the Board's decision and are reviewed at least annually. The terms of reference are available on rbs.com>about us. Chairman The role of Chairman is distinct and separate from that of the Group Chief Executive and there is a clear... -
Page 48
... team. The balance between non-executive and executive directors enables the Board to provide clear and effective leadership across the Group's business activities. The standard terms and conditions of appointment of non-executive directors are available on rbs.com or from RBS Secretariat. Board... -
Page 49
... opportunity to engage directly with divisional management on key issues and supports the Board's succession planning activity. Group Chairman Group Chief Executive Group Finance Director Senior Independent Director Board committee Chairs Group Secretary Group Chief Risk Officer Head of Conduct and... -
Page 50
... into statutory audit services; Government reforms on executive remuneration and reporting; and Developments in European company law and corporate governance. • preparing a detailed framework of key themes for discussion and questions which was used to structure individual meetings held... -
Page 51
... complex work well throughout the year, providing strong support to the Board. • • the Group Chief Executive and Group Finance Director meet regularly with UKFI, the organisation set up to manage the Government's investments in financial institutions, to discuss the strategy and financial... -
Page 52
... into account business requirements and industry developments. In 2013 discussions focused principally on executive director succession and the search for new non-executive directors. The Board also held a separate session on succession planning for the Executive Committee in June 2013. Group Chief... -
Page 53
... The chart below sets out the tenure of non-executive directors. The chart below details the gender diversity of the Board. Board and committee membership The Committee reviewed the membership of the Group Sustainability Committee during 2013 following feedback from the 2012 evaluation. It was... -
Page 54
...by the Group Audit and Board Risk Committees to the Group's business divisions and control functions continued in 2013. The programme allows members of the Committees to spend additional time with areas of the business which the Committees judge would benefit from a more detailed review. Invitations... -
Page 55
... focus. During 2013, the Committee spent a week in Asia to review the Markets, International Banking, Wealth, Business Services and Group Finance operations in the region. Internal Audit management made presentations to the Committee at two separate visits, covering functional strategy, bench... -
Page 56
... instruments carried at fair value including the Group's credit market exposures; the appropriateness of the carrying value of goodwill and other intangible assets, placing particular focus on International Banking and RBS Citizens Financial Group, Inc. Following an impairment review at year end... -
Page 57
... with the RBS Group Pension Fund. The Committee will monitor the investment strategy, capital impact and funding of the scheme during 2014, as negotiations progress. As discussed in the report of the Board Risk Committee, changes to the Divisional Risk and Audit Committee structure, designed to... -
Page 58
... services related to the accounting records or financial statements; the experience and expertise of the senior members of the engagement team; the proposed scope of the audit work planned and executed; the quality of dialogue between the External Auditor, the Committee and senior management... -
Page 59
... to the ad hoc approval process. Information on fees paid in respect of audit and non-audit services carried out by the External Auditor can be found in Note 5 to the consolidated accounts on page 403. The Group Audit Committee reviews the policy annually and prospectively approves the provision of... -
Page 60
...of conduct risk: employee conduct; market conduct; corporate conduct; and conduct towards customers. These standards have been applied in the Committee's consideration of issues including the review of the sale of interest rate hedging products to SME customers. The Committee has also placed renewed... -
Page 61
... into business as usual. More detailed information on each of these areas is set out in the Board Risk Committee report that follows. 2013 was a challenging year for the Board Risk Committee and I would like to extend my gratitude to my fellow members and to the Group's senior leadership team for... -
Page 62
... sessions with the Risk Management function to consider key risk areas and the risk strategy and operating model. Full details about the programme of visits is set out in the Report of the Group Audit Committee on page 53. Membership of the Board Risk Committee The Board Risk Committee comprises at... -
Page 63
... and policy RBS has a clear risk strategy supported by well defined strategic risk objectives. The members of the Board Risk Committee provide input to the overarching strategy for the business on an ongoing basis. During 2013, the Board Risk Committee reviewed the implementation of the Group Policy... -
Page 64
... new market risk caps and changes to the existing limits. In the second half of 2013 the Committee reviewed proposed changes to the Single Name Concentration framework for Banks and a new Single Name Concentration grid for Large Corporates. The Committee also considered the Economic Capital model... -
Page 65
... of the Board Risk Committee Risk architecture The Committee reviewed the preparations underway to ensure compliance with the new best practice principles that had been defined by the Basel Committee of Banking Supervision (BCBS) for internal risk reporting and data aggregation practices, which... -
Page 66
... conduct that supports the Group's values of serving customers, working together, doing the right thing and thinking long term; oversight of how the Group is balancing the needs of all its stakeholder groups including customers, investors, employees, regulators and communities/society and alignment... -
Page 67
... Committee held six Committee meetings in 2013 in addition to seven stakeholder engagements sessions. Both were attended by senior representatives from the customer facing divisions as well as Human Resources, Sustainability, Risk Management, Communications, Legal, Strategy and Corporate Services... -
Page 68
... Dear Shareholder, This year's remuneration report is published at an important moment for RBS. Five years on from the company's rescue, RBS is substantially safer and smaller, has a new Group Chief Executive, and has embarked on a new strategy positioning customers at its centre. In this changing... -
Page 69
...in 2013. Employee engagement is strong and clear evidence that key values are being embedded across the Group. • Decisions made on pay • Full details of decisions for both current and former directors are set out in this report. Ross McEwan's salary on appointment as Group Chief Executive... -
Page 70
... made across the business in 2014 will be less than 2%. RBS is a major UK employer and, as a bank playing a key role in the economic recovery, we understand the importance of getting our pay decisions right. We are committed to a high level of transparency and I believe the new reporting and voting... -
Page 71
... are directly applicable although any future salary increases will take into account performance rating during the year. Element of pay Base salary Operation Maximum potential value Paid monthly and reviewed annually. Determined annually. The rates for 2014 are as follows: Group Chief Executive... -
Page 72
...each): of fixed pay (i.e. base salary, • Economic Profit fixed share allowance, • Relative Total Shareholder benefits and pension). For Return (TSR) these purposes awards will • Safe and Secure Bank be valued in line with the • Customers and People European Banking Authority rules, including... -
Page 73
... shareholders. Changes for Executive Directors • EDs will no longer be eligible to receive annual bonuses. • The new structure outlined in the policy table introduces a fixed share allowance for EDs which will be released in equal tranches over a five year period. However, the Group Chief... -
Page 74
... and the level of fees paid to directors of comparable major UK companies. Non-executive directors do not participate in any incentive or performance plan. Non-executive directors' fees are reviewed regularly. Maximum potential value The rates for the year ahead are set out in the annual report on... -
Page 75
.... An annual employee opinion survey takes place which includes a number of questions on pay and culture. This includes questions as to whether employees believe they are paid fairly for the work they do, how remuneration at RBS compares to other financial services organisations and how good a job... -
Page 76
... review process, the disciplinary procedure and terms for dismissal in the event of personal underperformance or breaches of RBS policies. The Committee retains the discretion to make payments (including but not limited to professional and outplacement fees) to mitigate against legal claims... -
Page 77
... changes. The process takes place in sufficient time for shareholder views to be considered prior to the Committee making any final decisions on remuneration and variable pay awards. Details of shareholder voting on the resolution to approve the last remuneration report can be found in the annual... -
Page 78
... of the Asset Protection Scheme Senior Oversight Committee. (5) Art Ryan is a non-executive director of RBS Citizens Financial Group, Inc. for which he received fees of US$131,000 for the period to 30 September 2013, the date he retired from the Group Board. There have been no payments made to... -
Page 79
... applicable as CEO UK Retail and 24 months against the targets applicable as Group Chief Executive. Notes: The number of shares awarded is based on a multiple of salary and the award price is calculated based on the average share price over five business days prior to the grant date of £3.092 In... -
Page 80
.... Based on share price performance up to 31 December 2013, the threshold targets have not yet been met. Majority of Balance Sheet and Risk measures are currently on track or ahead of target. Cost:income ratio remains challenging to achieve largely due to market-driven income pressures. Positive... -
Page 81
... Financial Group and Head of RBS Americas. He continues to be employed within RBS and therefore no termination payment was made in connection with this change of role. Directors' interests in shares and shareholding requirements (audited) The target shareholding level for the Group Chief Executive... -
Page 82
... the Group's share plans (audited) Long-Term Incentive Plan (LTIP) awards Awards to executive directors under the LTIP are structured as conditional rights to receive shares and are subject to performance conditions and clawback provisions prior to vesting. Awards held at 1 January 2013 (or date of... -
Page 83
... 2013 and 2012 compared with the percentage change in the average remuneration of RBS employees on a global basis. In each case, remuneration is based on salary, benefits and annual bonus. The Group Chief Executive remuneration reflects the change in remuneration arrangements for the new Group Chief... -
Page 84
.... 2013 £m 2012 £m change Remuneration paid to all employees (1) Distributions to holders of ordinary shares Distributions to holders of preference shares Taxation and other charges recognised in the income statement: - Social security and other payments (2) - Bank levy - Corporation tax... -
Page 85
Annual report on remuneration 2014 Annual objectives for the Group Chief Executive and Group Finance Director The executive directors' annual objectives, as set out below, are approved by the Committee and reflect the Group's key strategic priorities. The Board Risk Committee has approved the risk ... -
Page 86
... Profit after Tax is Operating Profit taxed at a standard tax rate. • Attributed Equity is defined as equity allocated to the businesses, calculated as a function of the businesses risk-weighted asset base. • Current Cost of Equity is 11.0%, which is subject to review at least annually. Details... -
Page 87
... and deferral structure. Second quarter • Group Chief Executive departure terms and consideration of appointment and remuneration terms for various senior positions. Presentations from Markets, Corporate and Ulster Bank on business and strategic priorities and people plans. Review of the... -
Page 88
... ordinary share capital (including the B share capital), leaving an available dilution headroom of 5.8%. The company meets its employee share plan obligations through a combination of new issue shares and market purchase shares. Penny Hughes Chair of the Group Performance and Remuneration Committee... -
Page 89
... (1) Remuneration earned for period worked in 2013 at RBS for members of Group Executive Committee plus Group HR Director. (2) Disclosure includes prior year long-term incentive awards which vested during 2013. The amounts shown reflect the value of vested awards using the share price on the day the... -
Page 90
... could have a material impact on the income statement; and - Key control function roles The RBS Staff Dealing Rules and the conditions attaching to discretionary share-based awards prohibit the use of any personal hedging strategies to lessen the impact of a reduction in value of such awards. 88 -
Page 91
... and/or new information would change the annual bonus and/or LTIP decisions made in previous years, and/or the decisions to be made in the current year. • The process for review assessments (which consider material risk management, control and general policy breach failures, accountability for... -
Page 92
...high levels of income including those involved in managing trading activity and supporting clients with more complex financial transactions, including financial restructuring. Those responsible for managing our balance sheet and liquidity and funding positions across the business. Employees managing... -
Page 93
... by the Group, which operated throughout the year ended 31 December 2013 and to 26 February 2014, the date the directors approved the Report and Accounts. This is confirmed by a semi-annual Control Environment Certification process which requires senior members of the executive and management to... -
Page 94
... affect, the company's internal control over financial reporting. The New York Stock Exchange As a foreign issuer with American Depository Shares representing ordinary shares, preference shares and debt securities listed on the New York Stock Exchange (the "NYSE"), the company is not required... -
Page 95
...The directors present their report together with the audited accounts for the year ended 31 December 2013. Group structure The company is a holding company owning the entire issued ordinary share capital of The Royal Bank of Scotland plc, the principal direct operating subsidiary undertaking of the... -
Page 96
... 2013, the Group reached an agreement with an investor consortium led by Corsair Capital and Centerbridge Partners for an investment in these businesses ahead of a stock market flotation. This includes 308 RBS branches in England and Wales and 6 NatWest branches in Scotland. The new bank will... -
Page 97
...Board representation. Further information on male/female representation at various levels of employment in the Group is included in the Strategic report on page 33. Further details on the Board diversity policy can be found at rbs.com>about us. This year the business has been recognised for its work... -
Page 98
... of ensuring 2013 coupon payments on discretionary hybrid capital securities were partly neutralised from a Core Tier 1 capital perspective. The shares were allotted to UBS AG at the subscription prices and determined by reference to the average market prices during the sale periods set out below... -
Page 99
... to all trustees of the Group's pension schemes. Post balance sheet events Other than those matters detailed in Note 42 on the consolidated accounts, there have been no significant events between the year end and the date of approval of these accounts which would require a change to or disclosure in... -
Page 100
... proposed that the Group's longstanding policy of not making contributions to any political party be changed. Shareholders will be asked to renew this authorisation at the Annual General Meeting in 2014. Aileen Taylor Secretary 26 February 2014 The Royal Bank of Scotland Group plc is registered in... -
Page 101
... are of the opinion that the Annual Report and Accounts, taken as a whole, is fair, balanced and understandable and provides the information necessary for shareholders to assess the company's performance, business model and strategy. By order of the Board Philip Hampton Chairman 26 February 2014... -
Page 102
... of information Forward-looking statements Description of business Competition Risk factors Key financials Summary consolidated income statement Results summary Analysis of results Divisional performance RBS Capital Resolution Consolidated balance sheet Cash flow Capital resources Reconciliations... -
Page 103
...the term 'company' or 'RBSG' means The Royal Bank of Scotland Group plc, 'RBS', 'RBS Group' or the 'Group' means the company and its subsidiaries, 'the Royal Bank' or 'RBS plc' means The Royal Bank of Scotland plc and 'NatWest' means National Westminster Bank Plc. The company publishes its financial... -
Page 104
... the income statement. Reconciliations between managed and statutory results are detailed on pages 169 to 171. Glossary A glossary of terms is provided on pages 549 to 556. own credit adjustments; Payment Protection Insurance (PPI) costs; Interest Rate Hedging Products redress and related costs... -
Page 105
... senior management or other key employees; regulatory or legal changes (including those requiring any restructuring of the Group's operations) in the UK, the US and other countries in which the Group operates or a change in UK Government policy; changes to regulatory requirements relating to capital... -
Page 106
...'s trading and structuring teams to meet the client's objectives across financing, risk management, investment, securitisation and liquidity. A new strategy for the Markets division was announced in June 2013 enabling RBS to concentrate on its core customers' needs where the Markets business is... -
Page 107
... NatWest branches in Scotland. The new bank will be called Williams & Glyn, the brand RBS used for its branches in England and Wales before 1985. In March 2013 and September 2013, the Group sold a further 16.8% and 20% respectively of the total issued share capital in Direct Line Insurance Group plc... -
Page 108
...new entrants active and seeking to build their platforms by acquiring businesses made available through restructuring of incumbents. The Group distributes life assurance products to banking customers in competition with independent advisors and life assurance companies. In the UK credit card market... -
Page 109
... senior management, which may include members of the Group Board, or other key employees, and it may suffer if it does not maintain good employee relations. The Group is subject to a number of regulatory initiatives which may adversely affect its business, including the UK Government's adoption... -
Page 110
... Group including on dividend policy, the election of directors or appointment of senior management or limiting the Group's operations. The offer or sale by the UK Government of all or a portion of its shareholding in the company could affect the market price of the equity shares and other securities... -
Page 111
... own debt, Asset Protection Scheme, strategic disposals and RFS MI. In the statutory consolidated income statement, these items are included in total income. (2) Operating (loss)/profit on a managed basis excludes own credit adjustments, PPI costs, Interest Rate Hedging Products redress and related... -
Page 112
Business review Summary consolidated income statement for the year ended 31 December 2013 In the income statement set out below, own credit adjustments, PPI costs, Interest Rate Hedging Products redress and related costs, regulatory and legal actions, sovereign debt impairment and related interest ... -
Page 113
Business review Managed 2013 £m 2012* £m 2011* £m 2013 £m Statutory 2012* £m 2011* £m Basic loss per ordinary and equivalent B share from continuing operations Own credit adjustments Payment Protection Insurance costs Interest Rate Hedging Products redress and related costs Regulatory and ... -
Page 114
... Capital. The UK bank levy is based on the total chargeable equity and liabilities as reported in the balance sheet at the end of a chargeable period. The cost of the levy to the Group for 2013 was £200 million compared with £175 million in 2012. Interest Rate Hedging Products redress and related... -
Page 115
...Markets and International Banking (M&IB) that took place during 2012. Liability management exercises undertaken by the Group during 2012 resulted in a net gain of £454 million (2011 - £255 million). The UK bank levy is based on the total chargeable equity and liabilities as reported in the balance... -
Page 116
... tax assets in Australia following the strategic changes to the Markets and International Banking businesses announced in January 2012 and the effect of the two reductions of 1% in the rate of UK corporation tax enacted in March 2012 and July 2012 on the net deferred tax balance. Earnings per share... -
Page 117
Business review Analysis of results Net interest income Managed 2013 £m 2012* £m 2011* £m 2013 £m Statutory 2012 £m 2011 £m Interest receivable (1,2,3,4,5) Interest payable (1,3,4) Net interest income Yields, spreads and margins of the banking business Gross yield on interest-earning assets ... -
Page 118
Business review Average balance sheet and related interest Managed 2013 Average balance £m Interest £m Rate % Average balance £m Managed 2012* Interest £m Rate % Assets Loans and advances to banks Loans and advances to customers Debt securities Interest-earning assets Total interest-earning ... -
Page 119
Business review Managed 2011* Average balance £m Interest £m Rate % Assets Loans and advances to banks Loans and advances to customers Debt securities Interest-earning assets Total interest-earning assets Interest-earning assets Non-interest-earning assets Total assets Percentage of assets ... -
Page 120
Business review Average balance sheet and related interest continued Statutory 2013 Average balance £m Interest £m Rate % Average balance £m Statutory 2012 Interest £m Rate % Assets Loans and advances to banks Loans and advances to customers Debt securities Interest-earning assets Total ... -
Page 121
... Liabilities Deposits by banks Customer accounts: demand deposits Customer accounts: savings deposits - UK - Overseas - UK - Overseas - UK - Overseas Customer accounts: other time deposits - UK - Overseas Debt securities in issue Subordinated liabilities Internal funding of trading business Interest... -
Page 122
...deposits UK Overseas Customer accounts: other time deposits UK Overseas Debt securities in issue UK Overseas Subordinated liabilities UK Overseas Internal funding of trading business UK Overseas Total interest payable of the banking business UK Overseas 478 441 919 Movement in net interest income UK... -
Page 123
... UK Overseas Customer accounts: other time deposits UK Overseas Debt securities in issue UK Overseas Subordinated liabilities UK Overseas Internal funding of trading business UK Overseas Total interest payable of the banking business UK Overseas 1,271 1,055 2,326 Movement in net interest income UK... -
Page 124
Business review Non-interest income Managed (1) 2013 £m 2012* £m 2011* £m 2013 £m Statutory 2012 £m 2011 £m Fees and commissions receivable Fees and commissions payable Income from trading activities - excluding Asset Protection Scheme - Asset Protection Scheme Gain on redemption of own debt... -
Page 125
... the disposal of RBS Aviation Capital in June 2012, which resulted in lower rental income in Non-Core, partially offset by a lower fair value charge on the Asset Protection Scheme. The continuing strengthening of RBS's credit profile resulted in a £4,649 million accounting charge in relation to own... -
Page 126
Business review Operating expenses Managed (1) 2013 £m 2012* £m 2011* £m 2013 £m Statutory 2012* £m 2011* £m Staff costs Premises and equipment Other administrative expenses - Payment Protection Insurance costs - Interest Rate Hedging Products redress and related costs - regulatory and legal... -
Page 127
... current experience of Payment Protection Insurance complaints received, RBS increased its PPI provision by £1,110 million in 2012, bringing the cumulative charge taken to £2.2 billion, of which £1.3 billion in redress had been paid by 31 December 2012. On 31 January 2013, the Financial Services... -
Page 128
... restructuring of Markets and International Banking announced in January 2012. Accruals in relation to restructuring costs are set out below. At 1 January 2013 £m Currency translation adjustments £m Charge to income statement £m Utilised during the year £m At 31 December 2013 £m Staff costs... -
Page 129
Business review Impairment losses Managed (1) 2013 £m 2012 £m 2011 £m 2013 £m Statutory 2012 £m 2011 £m New impairment losses Less: recoveries of amounts previously written-off Charge to income statement Comprising: Loan impairment losses Securities - sovereign debt impairment and related ... -
Page 130
... value of deferred tax assets in Australia following the strategic changes to the Markets and International Banking businesses announced in January 2012, and the effect of the two reductions of 1% in the rate of UK corporation tax enacted in March 2012 and July 2012 on the net deferred tax balance... -
Page 131
...division UK Retail UK Corporate Wealth International Banking Ulster Bank US Retail & Commercial Retail & Commercial Markets Central items Core Non-Core Operating (loss)/profit - managed basis Own credit adjustments Payment Protection Insurance costs Interest Rate Hedging Products redress and related... -
Page 132
... 2012 £bn 3.95 3.06 3.23 1.73 1.87 3.03 2.96 0.60 1.89 2011 £bn Risk-weighted assets by division UK Retail UK Corporate Wealth International Banking Ulster Bank US Retail & Commercial Retail & Commercial Markets Other Core Non-Core Group before benefit of Asset Protection Scheme Benefit of Asset... -
Page 133
Business review Employee numbers at 31 December (full time equivalents rounded to the nearest hundred) 2013 2012 2011 UK Retail UK Corporate Wealth International Banking Ulster Bank US Retail & Commercial Retail & Commercial Markets Central items Core Non-Core Business Services Integration and ... -
Page 134
... losses Impairment losses Operating profit Analysis of income by product Personal advances Personal deposits Mortgages Cards Other Total income Analysis of impairments by sector Mortgages Personal Cards Total impairment losses Loan impairment charge as % of gross customer loans and advances... -
Page 135
Business review 2013 £bn 2012 £bn 2011 £bn Capital and balance sheet Loans and advances to customers (gross) - mortgages - personal - cards Loan impairment provisions Net loans and advances to customers Risk elements in lending Provision coverage (2) Customer deposits - current accounts - ... -
Page 136
... phase of the UK Government's Help To Buy scheme. Gross lending increased to £8.9 billion in H2 2013. Customer deposits increased by 7%, above the UK market average of 4% due to strong growth in both current accounts (13%) and instant access savings accounts (15%). Net interest income was broadly... -
Page 137
... income Direct expenses - staff - other Indirect expenses Profit before impairment losses Impairment losses Operating profit Analysis of income by business Corporate and commercial lending Asset and invoice finance Corporate deposits Other Total income Analysis of impairments by sector Financial... -
Page 138
Business review UK Corporate continued 2013 2012 2011 Performance ratios Return on equity (1) Net interest margin Cost:income ratio Capital and balance sheet Loans and advances to customers (gross) - financial institutions - hotels and restaurants - housebuilding and construction - manufacturing -... -
Page 139
... with UK Corporate's skills-based volunteering scheme, a programme offering all employees five days to volunteer with a charitable organisation, UK Corporate continued to deliver on its on-going commitment to communities. 2013 compared with 2012 The business delivered a return on equity of 11... -
Page 140
... 76% £bn Capital and balance sheet Loans and advances to customers (gross) - mortgages - personal - other Loan impairment provisions Net loans and advances to customers Risk elements in lending Provision coverage (2) Assets under management (excluding deposits) Customer deposits Loan:deposit ratio... -
Page 141
... in change programmes, including the development of new products and services capability and the implementation of RDR in the UK. Expenses also increased as a result of client redress following a past business review into the sale of the ALICO Enhanced Variable Rate Fund announced in November 2011... -
Page 142
...Banking Net interest income Non-interest income Total income Direct expenses - staff - other Indirect expenses Profit before impairment losses Impairment losses Operating profit Of which: Ongoing businesses Run-off businesses Analysis of income by product Cash management Trade finance Loan portfolio... -
Page 143
...debt financing, risk management and transaction services across its network. Business conditions remain challenging as themes of low interest rates and margin compression continue. International Banking remained focused on cost discipline throughout 2013 and continued to strengthen its balance sheet... -
Page 144
...'s credit rating downgrade and the Group technology incident in June 2012 outweighed economic pressures. This, coupled with the managed reduction in loans and advances to customers, improved the loan:deposit ratio to 91%. Bank deposits were down 51%, mainly as a result of lower short-term balances... -
Page 145
...Operating loss Analysis of income by business Corporate Retail Other Total income Analysis of impairments by sector Mortgages Commercial real estate - investment - development Other corporate Other lending Total impairment losses Of which RCR related (1) Loan impairment charge as % of gross customer... -
Page 146
Business review Ulster Bank continued 2013 £bn 2012 £bn 2011 £bn Capital and balance sheet Loans and advances to customers (gross) - mortgages - commercial real estate - investment - development - other corporate - other lending Loan impairment provisions Net loans and advances to customers ... -
Page 147
... for 2012 was driven by a combination of new defaulting customers and deteriorating security values. Risk elements in lending increased by £2 billion during the year reflecting continued difficult conditions in both the commercial and residential property sectors. The loan to deposit ratio improved... -
Page 148
... Operating profit Average exchange rate - US$/£ Analysis of income by product Mortgages and home equity Personal lending and cards Retail deposits Commercial lending Commercial deposits Other Total income Analysis of impairments by sector Residential mortgages Home equity Corporate and commercial... -
Page 149
Business review 2013 US$bn 2012 US$bn 2011 US$bn 2013 £bn 2012 £bn 2011 £bn Capital and balance sheet Loans and advances to customers (gross) - residential mortgages - home equity - corporate and commercial - other consumer Loan impairment provisions Net loans and advances to customers ... -
Page 150
... range of commercial banking operations in Chicago including Asset-Based Lending, Asset Finance, Equipment Leasing, Commercial Real Estate, Treasury Solutions, Capital Markets, Sponsor Finance, Franchise Finance and the majority of its corporate banking business. (2) Source: SNL Financial. Based on... -
Page 151
Business review 2013 compared with 2012 Operating profit of £647 million ($1,012 million) was down £107 million ($184 million), or 14%. The operating environment and market conditions remained challenging, with intense competition for loans. An extended period of low short-term rates limited net ... -
Page 152
... RCR and related strategy. (2) The ongoing businesses include the Rates, Currencies, Asset backed products and credit markets areas. (3) Divisional return on equity is based on divisional operating profit after tax divided by average notional equity (based on 10% of the monthly average of divisional... -
Page 153
... repos) Bank deposits (excluding repos) Risk-weighted assets - credit risk - non-counterparty - counterparty - market risk - operational risk Total risk-weighted assets Income statement (ongoing business) Total income Direct expenses Indirect expenses Impairment (losses)/recoveries Operating profit... -
Page 154
... balance sheet and risk resources deployed by the business. Credit Markets reflected the previous year's de-risking of credit trading and witnessed a modest reduction in Debt Capital Markets income, although the business executed a number of significant transactions and retained its leading position... -
Page 155
... not repeated. Offsetting these costs, profits on Group Treasury available-for-sale bond disposals totalled £880 million compared with £516 million in 2011, as active management of the liquid assets portfolio as well as favourable market conditions enabled the Group to crystallise gains on some... -
Page 156
...of (loss)/income by business Banking & portfolios International businesses Markets Total income Loss from trading activities Monoline exposures Credit derivative product companies Asset-backed products (2) Other credit exotics Equities Banking book hedges Other 2013 £m 2012 £m 2011 £m (61) 55... -
Page 157
... derivatives) Risk elements in lending (1) Provision coverage (2) Customer deposits (1) Risk-weighted assets - credit risk - non-counterparty - counterparty - market risk - operational risk Total risk-weighted assets Gross customer loans and advances Banking & portfolios International businesses... -
Page 158
...represents loan impairment provisions as a percentage of risk elements in lending. (3) Disposals of £0.8 billion have been signed as at 31 December 2013 but are pending completion (2012 and 2011 - £0.2 billion). 2013 £bn 2012 £bn 2011 £bn Commercial real estate third party assets UK (excluding... -
Page 159
... Corporate Ulster Bank Mortgages Commercial real estate - investment - development Other corporate Other EMEA Total Ulster Bank US Retail & Commercial Auto and consumer Cards SBO/home equity Residential mortgages Commercial real estate Commercial and other Total US Retail & Commercial International... -
Page 160
... UK Corporate Ulster Bank Commercial real estate - investment - development Other corporate Other EMEA Total Ulster Bank US Retail & Commercial Auto and consumer Cards SBO/home equity Residential mortgages Commercial real estate Commercial and other Total US Retail & Commercial Markets Manufacturing... -
Page 161
... income of £407 million was driven by a 31% fall in interest earning assets driven by run-off and disposals. Headcount declined by 1,700, or 55% to 1,400 of which 1,000 relates to operations in India and Romania, reflecting divestment activity and runoff. 2012 compared with 2011 Third party assets... -
Page 162
... progress of RCR, including funding and capital employed and released. Furthermore, a Board Oversight Committee ('BOC') has been set up reporting directly to the Group Board, to report on adherence to asset management principles and recommend changes to strategy where appropriate. The BOC comprises... -
Page 163
...£11 billion. Capital deductions comprised expected losses less impairment provisions (31 December 2013 - £1,774 million; 30 June 2013 - £6,047 million) and allocation of defined pension fund deficit (31 December 2013 - £58 million; 30 June 2013 - £38 million). Additional details are set out on... -
Page 164
Business review RBS Capital Resolution continued The impact of the revised strategy on key metrics of the Group are set out below. Group £bn RCR £bn Rest of the Group £bn Funded assets Non-Core Ulster Bank UK Corporate International Banking Markets Other divisions 28.0 28.0 105.0 48.5 212.8 317... -
Page 165
Business review Estimated funded assets (third party assets excluding derivatives or TPA) and RWAe of RCR Analysis of the funded assets and RWAe of RCR at 31 December 2013 and the related position at 30 June 2013 (the starting point for the identification of the portfolios of RCR), are set out ... -
Page 166
... agreements and stock lending Customer accounts Debt securities in issue Settlement balances Short positions Derivatives Accruals, deferred income and other liabilities Retirement benefit liabilities Deferred tax Insurance liabilities Subordinated liabilities Liabilities of disposal groups Total... -
Page 167
... within Markets and Group Treasury in holdings of UK and Eurozone government securities and financial institution bonds. Equity shares decreased by £6.4 billion, 42%, to £8.8 billion due to the targeted run-down of Markets' equities business. Movements in the value of derivative assets, down... -
Page 168
...Group's defined benefit pension schemes, primarily arising from significant reductions in the real discount rates in the Sterling, Euro and US dollar currency zones. These were partially offset by the £0.6 billion excess of employer contributions paid over the current year pension charge. Insurance... -
Page 169
...cash flows from operating activities Net cash flows from investing activities Net cash flows from financing activities Effects of exchange rate changes on cash and cash equivalents Net (decrease)/increase in cash and cash equivalents *Restated - see page 102. 2013 £m 2012* £m 2011* £m (30,631... -
Page 170
... regulatory purposes. 2013 £m 2012 £m 2011 £m 2010 £m 2009 £m Capital base Tier 1 capital Tier 2 capital Less: supervisory deductions Total regulatory capital Risk-weighted assets Credit risk - non-counterparty - counterparty Market risk Operational risk Asset Protection Scheme relief 291,100... -
Page 171
...items £m Managed £m Statutory £m Net interest income Non-interest income Total income Operating expenses Operating profit before impairment losses Impairment losses Operating loss Own credit adjustments Payment Protection Insurance costs Interest Rate Hedging Products redress and related costs... -
Page 172
... Operating profit/(loss) Own credit adjustments Payment Protection Insurance costs Interest Rate Hedging Products redress and related costs Regulatory and legal actions Integration and restructuring costs Gain on redemption of own debt Write-down of goodwill Asset Protection Scheme Amortisation... -
Page 173
... £m Managed £m Statutory £m Net interest income Non-interest income Total income Operating expenses Operating profit before impairment losses Impairment losses Operating profit/(loss) Own credit adjustments Payment Protection Insurance costs Sovereign debt impairment and related interest rate... -
Page 174
... tax Other financial assets Prepayments, accrued income and other assets Assets of disposal groups Total assets Liabilities Bank deposits Repos Deposits by banks Customer deposits Repos Customer accounts Debt securities in issue Settlement balances Short positions Derivatives Accruals, deferred... -
Page 175
Business review 2013 Balance sheet £m Disposal groups (1) £m Gross of disposal groups £m Balance sheet £m 2012 Disposal groups (2) £m Gross of disposal groups £m Balance sheet £m 2011 Disposal groups (3) £m Gross of disposal groups £m Selected financial data Gross loans and advances to ... -
Page 176
Business review Risk and balance sheet management Risk and balance sheet management 175 Risk governance 183 Risk appetite 192 Capital management 209 Liquidity and funding risk 227 Credit risk 268 Balance sheet analysis 318 Market risk 341 Country risk 354 Other risks 174 -
Page 177
Business review Risk and balance sheet management Risk governance 176 176 177 177 178 179 181 Governance structure Risk management Conduct and Regulatory Affairs Business model Risk events and lessons learned Top and emerging risk scenarios Stress testing 175 -
Page 178
.... The Group Chief Risk Officer reports directly to the Group Chief Executive and the Board Risk Committee, with a right of access to the Chairman of the Board Risk Committee. RBS Risk Management is designed to align as closely as possible with the customer-facing businesses and support functions... -
Page 179
... to interest rate and foreign exchange risk. Markets also helps customers structure securitisation transactions and issue debt. In addition, Ulster Bank and Citizens Bank, offer loan and investment products, as well as transactional services, to individuals and corporations. The customers of Ulster... -
Page 180
Business review Risk and balance sheet management Risk governance* continued Business model continued Over the last few years, the Group has either exited or sold a number of businesses in order to align its cost structure with its smaller scope and scale. In addition, it is reducing costs through ... -
Page 181
... in the Group. A rate setting review board was also created to oversee the submission process. For more information on LIBOR related settlements, refer to page 477. Payment Protection Insurance Since the judicial review decision in 2011, the Group has worked closely with both the Financial Conduct... -
Page 182
... of 2013, it was subject to shareholder litigation, securities related litigation, various class actions claims, including those related to LIBOR and foreign exchange trading, and mass consumer claims such as those related to Payment Protection Insurance and interest rate hedging products. This risk... -
Page 183
... to embed stress testing as a key risk management technique into mainstream risk reporting, capital planning and business processes at divisional, legal entity and Group levels. The Executive Risk Forum (refer to Risk governance on page 176 for further information) is the main body overseeing the... -
Page 184
... to senior management semi-annually. Once simply conducted principally to meet regulatory requirements, it is now an integral part of enterprise risk management and used to assess the impact of business decisions on the Group's capital position. As part of the financial planning and strategy cycle... -
Page 185
...Strategic risk objectives Risk appetite measures - Divisional risk appetite statements - Risk control frameworks and limits Culture, values and remuneration - Objectives for risk culture - Risk culture policies - Training - Challenge mechanisms - Risk-based key performance indicators - Risk coverage... -
Page 186
... commercial strategies with the most effective use of financial resources, such as capital, funding and risk capacity. Risk appetite provides a solid platform that allows the Group to focus on its key business strengths and competitive advantages over the long term. The Board Risk Committee reviews... -
Page 187
... customers, employees, investors and the general public) and is closely aligned with key risk policies and controls (e.g. the Group Policy Framework, conduct risk and reputational risk). Risk control frameworks and limits - Risk control frameworks set detailed tolerances and limits for material risk... -
Page 188
... risk and uses both absolute and relative risk measures. Risk culture policies The Group's values - of "serving customers well", "working together", "doing the right thing" and "thinking long term" - act as a clear starting point for a strong and effective risk culture. A wide range of communication... -
Page 189
... Equity Tier 1 ratio of c.11% by the end of 2015 and 12% or above by the end of 2016. The timely run-down of RCR and the successful divestment of Citizens are key to the achievement of the Group's capital plans. Refer to the Capital management section on pages 192 to 208 for further information... -
Page 190
... Basel models. Refer to the Credit risk and Balance sheet analysis sections on pages 227 to 317 for further information. Market risk The risk of loss arising from fluctuations in interest rates, credit spreads, foreign currency rates, equity prices, commodity prices and other risk-related factors... -
Page 191
...International Banking, Ulster Bank (Ireland), Group Centre (mainly Treasury), US Retail & Commercial and Non-Core. It has the potential to affect parts of the Group's credit portfolio that are directly or indirectly linked to the country in question. How the Group manages risk and the focus in 2013... -
Page 192
...be used for managing pension risk and the financial strategy implications of the pension schemes as well as reviewing fund performance. The Committee reports to the Group Asset and Liability Committee on the material pension schemes that the Group is obliged to support. In 2013, various pension risk... -
Page 193
.... In 2013, the environmental, social and ethical risk management function was set up to address the reputational risk associated with the clients the Group chooses to do business with. It sets policy and provides guidance to avoid reputational risk relating to business engagements and lending to... -
Page 194
Business review Risk and balance sheet management Capital management 193 Definition 193 2013 overview 193 Regulatory developments 193 Governance 194 Economic capital 195 Capital resources 200 Estimated leverage ratio 202 Risk-weighted assets 205 Reconciliation between accounting and regulatory ... -
Page 195
... change. CAST reports through GALCO and comprises senior representatives from Risk Management, Group Finance and Group Treasury. Target capital ratios are set and monitored by the PRA for the Group. Management of capital is achieved by supervision of forecast capital and RWA over a five year time... -
Page 196
... through both internally and externally defined stress testing to identify potential changes in capital ratios in a range of scenarios. Basel II requires RWAs to be calculated for credit, market and operational risk with various approaches available to banks, with differing levels of sophistication... -
Page 197
... set out below. Current rules Capital Core Tier 1 Core Tier 1 (excluding Asset Protection Scheme (APS) in 2011) Tier 1 Total RWAs by risk Credit risk - non-counterparty - counterparty Market risk Operational risk APS relief 291.1 22.3 30.3 41.8 385.5 - 385.5 Risk asset ratios Core Tier 1 Core Tier... -
Page 198
Business review Risk and balance sheet management Capital management* continued Capital resources continued Current capital resources and CRR capital estimate A reconciliation between capital as reported under the current basis (Basel 2.5), transitional basis (PRA) and full basis (final CRR) is set... -
Page 199
Business review Risk and balance sheet management 2013 Current basis (Basel 2.5) £m Transitional basis (PRA) £m Full basis (final CRR) £m Current basis (Basel 2.5) £m 2012 Transitional basis (draft CRR) £m Full basis (draft CRR) £m 2011 Current basis (Basel 2.5) £m Shareholders' equity (... -
Page 200
... ended 31 December 2013. Supervisory Core Tier 1 £m Other Tier 1 £m Tier 2 £m deductions £m Total £m At 1 January 2013 Attributable loss net of movements in fair value of own credit Share capital and reserve movements in respect of employee share schemes Ordinary shares issued Foreign exchange... -
Page 201
Business review Risk and balance sheet management The table below analyses the movement in CET1 and Tier 2 capital on a FLB3 basis during the year ended 31 December 2013. CET1 £m Tier 2 £m Total £m At 1 January 2013 Attributable loss net of movements in fair value of own credit Share capital ... -
Page 202
.... The estimated leverage ratio, based on the Basel Committee on Banking Supervision (BCBS) proposal issued in January 2014, is detailed below. 2013 2012 Leverage % Exposure £bn Tier 1 capital £bn Leverage % Estimated leverage ratio CRR basis: Transitional measure Full end point measure Basel III... -
Page 203
... review Risk and balance sheet management 2013 CRR Basel III basis £bn BCBS basis £bn CRR basis £bn basis £bn 2012 Basel III basis £bn BCBS basis £bn Exposure measure Cash and balances at central banks Debt securities Equity shares Derivatives Loans and advances to banks and customers... -
Page 204
Business review Risk and balance sheet management Capital management* continued Estimated leverage ratio continued Off-balance sheet items UK Retail £bn UK Corporate £bn International Banking (1) £bn US Retail & Commercial £bn Markets £bn Other £bn Total £bn 2013 Unconditionally ... -
Page 205
Business review Risk and balance sheet management The table below analyses RWA movements by division during the year. US R&C (1) £bn UK Retail UK Corporate Wealth £bn IB (1) Ulster Bank £bn £bn Markets £bn Other £bn Core £bn Non-Core £bn RFS MI £bn Total £bn Total RWAs At 1 ... -
Page 206
Business review Risk and balance sheet management Capital management* continued Risk-weighted assets continued FLB3 and Basel 2.5 The following tables set out RWAs under future and current rules. Estimated FLB3 £bn Basel 2.5 £bn 2013 UK Retail UK Corporate Wealth International Banking Ulster ... -
Page 207
... Accounting of insurance and associates/ Regulatory balance sheet other entities (1) other entities (2) consolidation £m £m £m £m Assets Cash and balances at central banks Loans and advances to banks Loans and advances to customers Debt securities Equity shares Settlement balances Derivatives... -
Page 208
... 2013 Balance Consolidation sheet differences (1) £bn £bn Regulatory consolidation £bn Total EAD £bn Cash and balances at central banks Reverse repurchase agreements and stock borrowing Loans and advances Debt securities Equity shares Settlement balances Derivatives Intangible assets... -
Page 209
Business review Risk and balance sheet management RWA density The table below analyses EAD, RWAs and related RWA density by sector cluster. EAD OffEAD post CRM (1) Non-CCR credit risk £m CCR (2) £m Total £m Drawn balance £m On-balance sheet EAD £m Undrawn Undrawn EAD £m £m Offbalance sheet ... -
Page 210
Business review Risk and balance sheet management Capital management* continued RWA density continued EAD EAD post CRM (1) 2012 Non-CCR £m CCR (2) £m Total £m Drawn balance £m Undrawn £m Offbalance sheet £m RWAs £m EAD post CRM RWA density (3) % Sovereign Central banks Central government ... -
Page 211
... 217 - Wholesale funding 218 - Total funding by currency 218 - Notes issued 219 - Deposits and repos 219 - Firm financing 220 - Divisional loan:deposit ratios and funding surplus 220 - Maturity analysis 223 - Encumbrance 226 - Summary of assets available as collateral (on and off-balance sheet) 209 -
Page 212
... levels. In setting risk limits the Board takes into account the nature of the Group's various activities, the Group's overall risk appetite, market best practice and regulatory compliance. The Group Asset and Liability Management Committee (GALCO) sets and reviews the liquidity risk management... -
Page 213
...including the CFO and Group Treasurer. Liquidity risks are reviewed daily at a significant legal entity level and performance reported at least monthly to legal entity, divisional and Group Asset and Liability Management Committees. Any breach of internal metric limits will set in motion a series of... -
Page 214
... client cash. Secured financing and increased haircuts - Loss of secured funding capacity at contractual maturity date and incremental haircut widening, depending upon collateral type. Retail and commercial bank deposits - Substantial outflows as the Group could be seen as a greater credit risk than... -
Page 215
... Markets trading book, and is the ultimate responsibility of the Group Treasurer. This portfolio is held in the PRA regulated UK Defined Liquidity Group (UK DLG) comprising the Group's five UK banks: The Royal Bank of Scotland plc, National Westminster Bank Plc, Ulster Bank Limited, Coutts & Company... -
Page 216
... National Westminster Bank Plc, Ulster Bank Limited, Coutts & Company and Adam & Company plc. In addition, certain of the Group's significant operating subsidiaries - RBS N.V., RBS Citizens Financial Group, Inc. (CFG) and Ulster Bank Ireland Limited - hold locally managed portfolios of liquid assets... -
Page 217
Business review Risk and balance sheet management Net stable funding ratio (NSFR)* The table below shows the composition of the Group's NSFR, based on the current interpretation of the expected final rules. The Group's NSFR may change over time in line with regulatory developments and related ... -
Page 218
... the Group's customer lending activities. Complementary to its deposit funding, the Group also accesses various wholesale markets for funding, on both a public and private basis. These include long-term secured and unsecured debt, short-term money markets and repurchase agreements. The Group has set... -
Page 219
...Less than 1 year £m 2011 More than 1 year £m Total £m Deposits by banks derivative cash collateral other deposits Debt securities in issue conduit asset-backed commercial paper (ABCP) other commercial paper (CP) certificates of deposit (CDs) medium-term notes (MTNs) covered bonds securitisations... -
Page 220
Business review Risk and balance sheet management Funding risk continued Analysis continued Total funding by currency 2013 GBP £m USD £m EUR £m Other £m Total £m Deposits by banks Debt securities in issue commercial paper certificates of deposit medium-term notes covered bonds securitisations... -
Page 221
... above are insured through the UK Financial Services Compensation Scheme, US Federal Deposit Insurance Corporation scheme and other similar schemes. Of the personal and corporate deposits above, 53% relate to personal customers. Firm financing* The Group has access to the short-term money markets to... -
Page 222
.../(gap) £m 2012 Loan:deposit ratio % Funding (gap)/surplus £m 2011 Loan:deposit ratio % Funding (gap)/surplus £m UK Retail UK Corporate Wealth International Banking Ulster Bank US Retail & Commercial Conduits (3) Retail & Commercial Markets Other Core Non-Core Direct Line Group Group nm = not... -
Page 223
... - Corporate - Financial Institutions Debt securities Equity shares Settlement balances Derivatives Total financial assets Bank repos Customer repos Deposits by banks Customer accounts - Personal - Corporate - Financial Institutions Debt securities in issue Settlement balances Short positions... -
Page 224
... - Financial Institutions Debt securities Equity shares Settlement balances Derivatives Other assets Total financial assets Bank repos Customer repos Deposits by banks Customer accounts - Personal - Corporate - Financial Institutions Debt securities in issue Settlement balances Short positions... -
Page 225
...used to support funding currently in place via own asset securitisations, covered bonds and securities repurchase agreements. • not currently encumbered but can for instance be used to access funding from market counterparties or central bank facilities as part of the Group's contingency funding... -
Page 226
...set by the central banks, primarily US, including date of origination and level of documentation. (e) non-recourse invoice financing balances and certain shipping loans whose terms and structure prohibit their use as collateral. (5) In accordance with market practice the Group employs its own assets... -
Page 227
Business review Risk and balance sheet management Encumbered assets relating to: Debt securities in issue Securitisations and conduits £bn Covered bonds £bn Other secured liabilities Derivatives £bn Repos £bn Total Secured encumbered deposits assets £bn £bn Encumbered assets as a % of related... -
Page 228
Business review Risk and balance sheet management Funding risk continued Summary of assets available as collateral (on and off-balance sheet)* The table below summarises total on and off-balance sheet assets that are available to support funding and collateral requirements. 2013 £bn Total on-... -
Page 229
... debt management - Wholesale - Wholesale forbearance - Retail - Retail forbearance - Recoveries - Group impairment loss provisioning - Provisioning methodology - Impact of forbearance on provisioning - Write-offs Key loan portfolios - Commercial real estate - Residential mortgages - Personal lending... -
Page 230
... Chief Risk Officer or the GCCO, approves recommendations from the divisional provisions committees. Key trends in the credit risk profile of the Group, performance against limits and emerging risks are set out in the RBS Risk Management Monthly Report provided to the Executive Committee, the Board... -
Page 231
... or stress testing. As a result of the reviews carried out in 2013, the Group further reduced its risk appetite in the corporate sectors of commercial real estate and retail. For further details on sector-specific strategies, exposure reduction and key credit risks, refer to pages 252 to 267. Single... -
Page 232
... review Risk and balance sheet management Credit risk continued Risk management* continued Retail Retail lending entails making a large number of small value loans. To ensure that it makes these lending decisions consistently, the Group analyses the historical debt servicing behaviour of customers... -
Page 233
... in banks and corporate exposure classes, planned for 2014. As in 2012, the impact of the model changes implemented in 2013 largely affected the lower risk segments of the Group's portfolios, mostly to customers bearing the equivalent of investment-grade ratings. Model changes affect year-on-year... -
Page 234
Business review Risk and balance sheet management Credit risk continued Credit risk assets* continued Divisional analysis 2013 £m 2012 £m 2011 £m UK Retail UK Corporate Wealth International Banking Ulster Bank US Retail & Commercial Retail & Commercial Markets Other Core Non-Core 113,223 97,... -
Page 235
Business review Risk and balance sheet management Sector and geographical regional analyses The table below details CRA by sector and geographical region. Sectors are based on the Group's sector concentration framework. Geographical region is based on the location of the customer's operations (or, ... -
Page 236
Business review Risk and balance sheet management Credit risk continued Credit risk assets* continued Key points Financial markets and the Group's focus on risk appetite and sector concentration had a direct impact on the portfolio during the year with the following key trends observed: • • ... -
Page 237
... shipping market segments in 2013, as charter rates and vessel values remained depressed. The majority of the Group's exposure is extended against security in vessels of recent construction, with less than 4% of the lending secured on vessels aged over 15 years. A key protection for the Group is... -
Page 238
...based approach is not available. 2013 AQ10 £m Divisional credit risk assets % 2012 AQ10 £m Divisional credit risk assets % 2011 AQ10 £m Divisional credit risk assets % AQ10 CRA by division UK Retail UK Corporate International Banking Ulster Bank US Retail & Commercial Retail & Commercial Markets... -
Page 239
Business review Risk and balance sheet management Key points • Trends in the asset quality of the Group's credit risk exposures during 2013 reflected the change in the proportion of assets in the sovereign sector and movements in the underlying asset quality of the portfolio. The Group's overall ... -
Page 240
... the credit risk arising from wholesale lending varies according to the nature of the counterparty and its assets. The most common types are: • • Commercial real estate - The market value of the collateral typically exceeds the loan amount at origination date. The market value is defined as... -
Page 241
Business review Risk and balance sheet management Ulster Bank Rest of the Group Total £m Performing £m Non-performing £m Total £m Performing £m Group Non-performing £m Total £m Commercial real estate loan-to-value ratio 2012 (4) Performing £m Non-performing £m 50% and -
Page 242
Business review Risk and balance sheet management Credit risk continued Risk mitigation continued The table below shows LTVs for the Group's residential mortgage portfolio split between performing (AQ1-AQ9) and non-performing (AQ10), with the average LTV calculated on a weighted value basis. Loan ... -
Page 243
Business review Risk and balance sheet management UK Retail Performing £m Nonperforming £m Total £m Performing £m Ulster Bank Nonperforming £m Total £m RBS Citizens (1) Performing £m Nonperforming £m Total £m Loan-to-value ratio 2011 50% and 70% and 90% and ... -
Page 244
...monitoring if needed. EWIs may be internal, such as a customer's bank account activity, or external, such as a publicly-listed customer's share price. If EWIs show a customer is experiencing potential or actual difficulty, divisional credit officers may decide to place it on the Watchlist. Watchlist... -
Page 245
... customer will benefit from access to alternative sources of liquidity, such as an issue of equity capital. These options are commonly used in commercial real estate transactions, particularly where a shortage of market liquidity rules out immediate refinancing and makes short-term collateral sales... -
Page 246
Business review Risk and balance sheet management Credit risk continued Early problem identification and problem debt management continued The table below shows the value of loans (excluding loans where the Group has initiated recovery procedures) where forbearance was completed during the year, by... -
Page 247
... used to support customers in financial difficulty since 2009, and from 2012 have only been permitted on a very exceptional basis for residential mortgage customers who are up to date on payments. As a result interest only loans with permanent changes to terms are historical stock. In Ulster Bank... -
Page 248
... loans that return to performing with no arrears. Retail forbearance loans can be modified more than once. Twelve month default rates are calculated for all mortgage forbearance types. In 2013, the average twelve month default rates were 8% for UK Retail, 18% for Ulster Bank and 13% for RBS Citizens... -
Page 249
Business review Risk and balance sheet management Arrears status and provisions The mortgage arrears information for retail accounts in forbearance and related provision are shown in the tables below. No missed payments Balance £m 2013 Provision £m 1-3 months in arrears Balance £m Provision £m ... -
Page 250
Business review Risk and balance sheet management Credit risk continued Early problem identification and problem debt management continued Forbearance arrangements The incidence of the main types of retail forbearance on the balance sheet are analysed below. UK Retail 2013 £m Ulster Bank £m RBS ... -
Page 251
Business review Risk and balance sheet management Key points UK Retail • At 31 December 2013, forbearance balances where the forbearance treatment was provided in the last 24 months amounted to £2.0 billion. This represented a 14% reduction in the year. • The flow of new forbearance of £380... -
Page 252
...across different portfolios from 2 to 225 days. They are based on actual experience within the particular portfolio and are reviewed regularly. The Group's retail businesses segment their performing loan books into homogeneous portfolios such as mortgages, credit cards or unsecured loans, to reflect... -
Page 253
... rate and the modelled PD for this separate risk pool is used when calculating the latent provision. Furthermore, for this portfolio the latent provision incorporates an extended emergence period. Once such loans are no longer separately identified, the use of account level PDs refreshed monthly... -
Page 254
... excludes rate risk management and contingent obligations. 2013 2012 Total £m Investment £m Development £m Total £m Investment £m 2011 Development £m Total £m Commercial real estate by division (1) Core UK Corporate Ulster Bank US Retail & Commercial International Banking Markets Investment... -
Page 255
Business review Risk and balance sheet management UK Ireland (excl NI (2)) (ROI and NI (2)) Western Europe £m US £m RoW (2) £m Total £m Commercial real estate by sub-sector (1) 2013 £m £m Residential Office Retail Industrial Mixed/other 8,740 4,557 6,979 3,078 6,926 30,280 6,560 813... -
Page 256
Business review Risk and balance sheet management Credit risk continued Key loan portfolios* continued US Retail & International Banking £m Markets £m Total £m UK Corporate £m Ulster Bank £m Commercial £m Commercial real estate maturity profile of portfolio 2013 Core < 1 year (1) 1-2 years ... -
Page 257
Business review Risk and balance sheet management Key points • The overall maturity profile remained relatively unchanged during 2013. • The majority of Ulster Bank's commercial real estate portfolio was categorised as under one year, owing to the high level of nonperforming assets in the ... -
Page 258
Business review Risk and balance sheet management Credit risk continued Key loan portfolios* continued The table below analyses commercial real estate (Core and Non-Core) lending by loan-to-value ratio, which represents loan value before provisions relative to the value of the property financed. ... -
Page 259
...number of different approaches are used across the Group and across geographies to calculate interest coverage ratios, they may not be comparable for different portfolio types and legal entities. Credit quality metrics relating to commercial real estate lending were as follows: Group 2013 2012 2011... -
Page 260
... sheet management Credit risk continued Key loan portfolios* continued Residential mortgages The table below analyses the mortgage portfolios and includes both Core and Non-Core. Total gross mortgage lending comprises 35% of the Group's gross lending of £418 billion. 2013 £m 2012 £m 2011 £m UK... -
Page 261
... than the customer pay rate; ii) credit scoring; iii) a maximum loan-to-value of 90% with the exception of the UK Government backed schemes Help-to-Buy (from the fourth quarter of 2013), New Buy and My New Home products where lending of up to 95% is provided; and iv) a range of policy rules that... -
Page 262
Business review Risk and balance sheet management Credit risk continued Key loan portfolios* continued Ulster Bank • Ulster Bank's residential mortgage portfolio was £19.0 billion at 31 December 2013, with 88% in the Republic of Ireland and 12% in Northern Ireland. At constant exchange rates, ... -
Page 263
...(1) The ratio for UK Retail assets refers to the impairment charge for the year. (2) The ratio for RBS Citizens refers to the impairment charge in the year, net of recoveries realised in the year. Key points UK Retail • The UK personal lending portfolio comprised credit cards, unsecured loans and... -
Page 264
Business review Risk and balance sheet management Credit risk continued Key loan portfolios* continued Interest only retail loans The Group's interest only retail loan portfolios include interest only mortgage lending in UK Retail, Ulster Bank, Wealth and RBS Citizens' portfolios of home equity ... -
Page 265
Business review Risk and balance sheet management 2013 Bullet principal repayment £bn Conversion to amortising £bn Total £bn Proportion of mortgage lending % Bullet principal repayment £bn 2012 Conversion to amortising £bn Total £bn Proportion of mortgage lending % UK Retail (1) Ulster Bank... -
Page 266
Business review Risk and balance sheet management Credit risk continued Key loan portfolios* continued The tables below analyse the Group's retail mortgage and HELOC portfolios between interest only mortgages (excluding mixed repayment mortgages) and other mortgage loans. Interest only Bullet ... -
Page 267
Business review Risk and balance sheet management Ulster Bank Group (Core and Non-Core) Overview At 31 December 2013, Ulster Bank Group accounted for 10% of the Group's total gross loans to customers (2012 and 2011 - 10%) and 8% of the Group's Core gross loans to customers (2012 and 2011 - 8%) ... -
Page 268
Business review Risk and balance sheet management Credit risk continued Key loan portfolios* continued Gross loans £m REIL as a % of gross loans % Credit metrics Provisions as a % of REIL % Provisions as a % of gross loans % Impairment charge £m Amounts written-off £m Sector analysis 2012 REIL... -
Page 269
Business review Risk and balance sheet management Key points • The commercial real estate lending portfolio for Ulster Bank Group (Core and Non-Core) totalled £14.3 billion at 31 December 2013, of which £10.1 billion or 71% was in Non-Core. The geographic split of the total Ulster Bank Group ... -
Page 270
Business review Risk and balance sheet management Balance sheet analysis 269 Financial assets 269 - Exposure summary 271 - Sector and geographic concentration 279 - Asset quality 284 Debt securities 293 Equity shares 296 Derivatives 299 REIL, provisions and AFS reserves 268 -
Page 271
Business review Risk and balance sheet management Balance sheet analysis Credit risk assets analysed on pages 231 to 237 are reported internally to senior management. However, they exclude certain exposures, primarily securities and reverse repurchase agreements and take account of legal netting ... -
Page 272
... (1) £bn Carrying value £bn Balance sheet offset (2) £bn Exposure post offset £bn 2012 Cash and balances at central banks Reverse repos Lending Debt securities Equity shares Derivatives (3) Settlement balances Other financial assets Total Short positions Net of short positions 2011 79.3 143... -
Page 273
Business review Risk and balance sheet management Sector and geographic concentration The following tables analyse financial assets by sector and geography. Geographical regions are based on the location of the lending or issuer. Reverse 2013 repos £m Lending £m Securities Debt £m Equity £m ... -
Page 274
Business review Risk and balance sheet management Balance sheet analysis continued Financial assets continued Reverse 2011 repos £m Lending £m Securities Debt £m Equity £m Derivatives £m Other financial assets £m Balance sheet value £m Offset (1) £m Exposure post offset £m Central and ... -
Page 275
... commercial real estate lending decreased by £7.1 billion. ° Reverse 2013 repos £m Lending £m Securities Debt £m Equity £m Derivatives £m Other financial assets £m Balance sheet value £m Offset (1) £m Exposure post offset £m UK Central and local government Financial institutions... -
Page 276
Business review Risk and balance sheet management Balance sheet analysis continued Financial assets continued Reverse 2013 repos £m Lending £m Securities Debt £m Equity £m Derivatives £m Other financial assets £m Balance sheet value £m Offset (1) £m Exposure post offset £m Europe Central ... -
Page 277
Business review Risk and balance sheet management Reverse 2012 repos £m Lending £m Securities Debt £m Equity £m Derivatives £m Other financial assets £m Balance sheet value £m Offset (1) £m Exposure post offset £m UK Central and local government Financial institutions - banks - other ... -
Page 278
Business review Risk and balance sheet management Balance sheet analysis continued Financial assets continued Reverse 2012 repos £m Lending £m Securities Debt £m Equity £m Derivatives £m Other financial assets £m Balance sheet value £m Offset (1) £m Exposure post offset £m Europe Central ... -
Page 279
Business review Risk and balance sheet management Reverse 2011 repos £m Lending £m Securities Debt £m Equity £m Derivatives £m Other financial assets £m Balance sheet value £m Offset (1) £m Exposure post offset £m UK Central and local government Financial institutions - banks - other ... -
Page 280
Business review Risk and balance sheet management Balance sheet analysis continued Financial assets continued Reverse 2011 repos £m Lending £m Securities Debt £m Equity £m Derivatives £m Other financial assets £m Balance sheet value £m Offset (1) £m Exposure post offset £m Europe Central ... -
Page 281
... type. All credit grades across the Group map to both a Group level asset quality scale, used for external financial reporting, and a master grading scale for wholesale exposures used for internal management reporting across portfolios. Debt securities are analysed by external ratings and are... -
Page 282
Business review Risk and balance sheet management Balance sheet analysis continued Financial assets continued Cash and balances at 2011 central banks £m Loans and advances Banks (1) £m Customers £m Settlement balances and other financial assets £m Derivatives...these tables refer to page 283. 280 -
Page 283
Business review Risk and balance sheet management Loans and advances Banks (1) Cash and balances at central banks £m Reverse repos £m Derivative cash collateral £m Customers Derivative Reverse cash repos collateral £m £m Settlement balances and other financial Contingent Total assets ... -
Page 284
Business review Risk and balance sheet management Balance sheet analysis continued Financial assets continued Loans and advances Banks (1) Cash and balances at central banks £m Reverse repos £m Derivative cash collateral £m Customers Derivative Reverse cash repos collateral £m £m Settlement ... -
Page 285
Business review Risk and balance sheet management Cash and balances at 2011 (2) central banks £m Loans and advances Banks (1) £m Customers £m Settlement balances and other financial assets £m Derivatives £m Commitments £m Contingent liabilities £m Total £m Non-Core AQ1 AQ2 AQ3 AQ4 AQ5 ... -
Page 286
... relating to asset-backed securities (ABS). Central and local government 2013 UK £m US £m Other £m Banks £m Other financial institutions £m Corporate £m Total £m Of which ABS £m Held-for-trading (HFT) Designated as at fair value Available-for-sale Loans and receivables Long positions... -
Page 287
Business review Risk and balance sheet management Key points HFT • UK and US government bonds and US agency ABS decreased reflecting sales and continued focus on balance sheet reduction and capital management in Markets. The decrease in other government bonds primarily comprised reductions in ... -
Page 288
Business review Risk and balance sheet management Balance sheet analysis continued Debt securities continued Central and local government 2012 UK £m US £m Other £m Banks £m Other financial institutions £m Corporate £m Total £m Total % Of which ABS £m Total AAA AA to AA+ A to AABBB- to ANon... -
Page 289
Business review Risk and balance sheet management Central and local government 2011 UK £m US £m Other £m Banks £m Other financial institutions £m Corporate £m Total £m Total % Of which ABS £m Total AAA AA to AA+ A to AABBB- to ANon-investment grade Unrated 22,451 - - - - - 22,451 45 40... -
Page 290
... and trades debt in the form of loan, bond and derivative instruments in all major currencies and debt capital markets in North America, Western Europe, Asia and major emerging markets. The carrying value of the Group's debt securities is detailed below. The Group's credit market activities gave... -
Page 291
Business review Risk and balance sheet management Product, geography and IFRS measurement classification US £m UK £m Europe £m RoW £m Total £m HFT £m DFV £m AFS £m LAR £m 2013 Gross exposure RMBS: government sponsored or similar RMBS: prime RMBS: non-conforming RMBS: sub-prime MBS: ... -
Page 292
Business review Risk and balance sheet management Balance sheet analysis continued Debt securities continued 2012 US £m UK £m Europe £m RoW £m Total £m HFT £m DFV £m AFS £m LAR £m Gross exposure RMBS: government sponsored or similar RMBS: prime RMBS: non-conforming RMBS: sub-prime MBS: ... -
Page 293
Business review Risk and balance sheet management 2011 US £m UK £m Europe £m RoW £m Total £m HFT £m DFV £m AFS £m LAR £m Gross exposure RMBS: government sponsored or similar RMBS: prime RMBS: non-conforming RMBS: sub-prime MBS: covered bond CMBS CDOs CLOs ABS covered bond Other ... -
Page 294
Business review Risk and balance sheet management Balance sheet analysis continued Debt securities continued Ratings The table below summarises the ratings of asset-backed securities on the balance sheet. RMBS Government sponsored or similar (1) £m Nonconforming £m MBS covered bond £m ABS ... -
Page 295
.... The HFT positions in Markets, primarily in run-off and recovery businesses, are used mainly for economic hedging of debt issuances and equity derivatives. The AFS portfolios include capital stock in the Federal Home Loan Bank (a government sponsored entity, included in other financial institutions... -
Page 296
Business review Risk and balance sheet management Balance sheet analysis continued Equity shares continued 2012 HFT Banks £m Other financial institutions (2) £m Corporate £m Total £m HFT short positions £m Banks £m AFS/DFV (1) Other financial institutions (2) £m Corporate £m Total £m Total... -
Page 297
Business review Risk and balance sheet management 2011 HFT Other financial institutions (2) £m HFT short positions £m AFS/DFV (1) Other financial institutions £m AFS reserves £m Countries Spain Ireland Italy Portugal Greece Eurozone periphery Netherlands France Luxembourg Germany Other Total ... -
Page 298
...balance sheet under IFRS. 2013 Notional (1) Other £bn Total £bn Assets £m Liabilities £m Notional (1) £bn Assets £m GBP £bn USD £bn Euro £bn 2012 Liabilities £m Notional (1) £bn Assets £m 2011 Liabilities £m Derivatives Interest rate (2) Exchange rate Credit Equity... -
Page 299
Business review Risk and balance sheet management Key points • Net exposure decreased by 47% (liabilities decreased by 38%) reflecting increased interest rate yields and continued use of trade compression cycles, partially offset by increased trade volumes. • • Sales and reduction in trade ... -
Page 300
... Sold £bn Bought £bn 2012 Fair value Bought £bn Sold £bn Notional Bought £bn Sold £bn 2011 Fair value Bought £bn Sold £bn Group Client-led trading and residual risk Credit hedging - banking book (1) Credit hedging - trading book - rates - credit and mortgage markets - other Total excluding... -
Page 301
Business review Risk and balance sheet management Monoline insurers The table below summarises the Group's monoline exposures. Fair value: reference protected assets £m Notional: protected assets £m Gross exposure £m Credit valuation adjustment £m Hedges £m Net exposure £m Counterparty ... -
Page 302
... the write-off of aged debt and the transfer of up-to-date mortgages to potential problem loans. Provision coverage remained broadly stable at 59%. REIL in UK Corporate increased 14% mainly driven by individual cases in the commercial real estate and shipping portfolios as credit conditions remained... -
Page 303
Business review Risk and balance sheet management Sector and geographical regional analyses: Group The tables below analyse gross loans and advances to banks and customers (excluding reverse repos) and related credit metrics by sector and geography (by location of lending office) for the Group, ... -
Page 304
Business review Risk and balance sheet management Balance sheet analysis continued REIL, provisions and AFS reserves continued Sector and geographical regional analyses: Group continued Credit metrics Gross loans £m REIL as a % of gross loans % Provisions as a % of REIL % Provisions as a % of ... -
Page 305
Business review Risk and balance sheet management Credit metrics Gross loans £m REIL as a % of gross loans % Provisions as a % of REIL % Provisions as a % of gross loans % Impairment charge £m Amounts written-off £m 2011 (1) REIL £m Provisions £m Central and local government Finance ... -
Page 306
Business review Risk and balance sheet management Balance sheet analysis continued REIL, provisions and AFS reserves continued Sector and geographical regional analyses: Core Credit metrics Gross loans £m REIL as a % of gross loans % Provisions as a % of REIL % Provisions as a % of gross loans % ... -
Page 307
Business review Risk and balance sheet management Credit metrics Gross loans £m REIL as a % of gross loans % Provisions as a % of REIL % Provisions as a % of gross loans % Impairment charge £m Amounts written-off £m 2012 (1) REIL £m Provisions £m Central and local government Finance ... -
Page 308
Business review Risk and balance sheet management Balance sheet analysis continued REIL, provisions and AFS reserves continued Sector and geographical regional analyses: Core continued Credit metrics Gross loans £m REIL as a % of gross loans % Provisions as a % of REIL % Provisions as a % of gross... -
Page 309
Business review Risk and balance sheet management Sector and geographical regional analyses: Non-Core Credit metrics Gross loans £m REIL as a % of gross loans % Provisions as a % of REIL % Provisions as a % of gross loans % Impairment charge £m Amounts written-off £m 2013 REIL £m Provisions ... -
Page 310
Business review Risk and balance sheet management Balance sheet analysis continued REIL, provisions and AFS reserves continued Sector and geographical regional analyses: Non-Core continued Credit metrics Gross loans £m REIL as a % of gross loans % Provisions as a % of REIL % Provisions as a % of ... -
Page 311
Business review Risk and balance sheet management Credit metrics Gross loans £m REIL as a % of gross loans % Provisions as a % of REIL % Provisions as a % of gross loans % Impairment charge £m Amounts written-off £m 2011 (1) REIL £m Provisions £m Central and local government Finance ... -
Page 312
... and accountants. The Group operates a transparent provisions governance framework, setting thresholds to trigger enhanced oversight and challenge. Analyses of provisions are set out on pages 312 to 314. Available-for-sale financial assets are initially recognised at fair value plus directly related... -
Page 313
Business review Risk and balance sheet management UK Retail £m UK Corporate £m Wealth £m International Banking £m Ulster Bank £m US Retail & Commercial £m Markets £m Core £m Non-Core £m Total £m At 1 January 2012 Currency translation and other adjustments Additions Transfers (1)... -
Page 314
... is used for advances which are not past due 90 days or revolving credit facilities where identification as 90 days overdue is not feasible. 2013 £m 2012 £m 2011 £m Potential problem loans 789 807 739 Both REIL and PPL are reported gross and take no account of the value of any security held... -
Page 315
Business review Risk and balance sheet management Non-Core (by donating division) UK Corporate £m International Banking £m Ulster Bank £m US R&C (1) £m Other £m Total £m At 1 January 2013 Currency translation and other adjustments Disposal of subsidiaries Amounts written-off Recoveries of ... -
Page 316
Business review Risk and balance sheet management Balance sheet analysis continued REIL, provisions and AFS reserves continued Non-Core (by donating division) UK Corporate £m International Banking £m Ulster Bank £m US R&C (1) £m Other £m Total £m At 1 January 2012 Currency translation and ... -
Page 317
... review Risk and balance sheet management Impairment charge analysis The table below analyses the impairment charge for loans and securities. UK Retail £m UK Corporate £m International Banking £m Ulster Bank £m US R&C £m Total R&C £m Central items £m Total Core £m 2013 Wealth £m Markets... -
Page 318
... below analyses available-for-sale debt securities and related reserves, gross of tax. 2013 UK £m US £m Other (1) £m Total £m UK £m 2012 US £m Other (1) £m Total £m UK £m 2011 US £m Other (1) £m Total £m Central and local government Banks Other financial institutions Corporate Total Of... -
Page 319
Business review Risk and balance sheet management AFS gross unrealised losses The table below shows the fair value of available-for-sale debt securities that were in an unrealised loss position at 31 December and the related gross unrealised losses. Less than 12 months Gross unrealised losses £m ... -
Page 320
Business review Risk and balance sheet management Market risk 319 319 321 322 334 Definition Sources of risk Governance structure Traded market risk Non-traded market risk 318 -
Page 321
... activities are included within the following markets: currencies; emerging markets; rates; asset-backed products; and traded credit. The Group undertakes transactions in financial instruments including debt securities, loans, deposits and equities, as well as securities financing and derivatives... -
Page 322
... agreements and stock borrowing Debt securities Equity shares Derivatives Settlement balances Other assets Total assets Liabilities Deposits by banks Customer deposits Repurchase agreements and stock lending Debt securities in issue Settlement balances Short positions Derivatives Subordinated... -
Page 323
...are used for the valuation of positions for which prices are not directly observable and for the risk management of the portfolio. Any pricing models that are used as the basis for valuing books and records are subject to approval and oversight by asset-level modelled product review committees. 321 -
Page 324
... granular set of limits and triggers. Limit reporting is supplemented with regulatory capital and stress testing information as well as ad hoc reporting. Finally, a market risk update is included in the monthly risk management report sent to Group Board. The update covers the key risks and trends... -
Page 325
...the market value of a portfolio (and, thus, the impact on the income statement) over a specified time horizon at a given confidence level. For internal risk management purposes, the Group's VaR assumes a time horizon of one trading day and a confidence level of 99%. The Group's VaR model is based on... -
Page 326
... whether or not to use local end-of-day timing, the internal model review committee balances the principle of aligning the treatment of positions and their associated hedges against the goal of using London end-of-day timing consistently. Risk factors relevant to a specific portfolio may be omitted... -
Page 327
Business review Risk and balance sheet management 1-day 99% traded internal VaR table The table below analyses the internal VaR for the Group's trading portfolios, segregated by type of market risk exposure, and split between Core, NonCore and CEM. 2013 Average £m Period end £m Maximum £m ... -
Page 328
Business review Risk and balance sheet management Market risk continued Traded market risk continued VaR validation* In addition to the independent VaR model reviews carried out by GRA (discussed on page 323), a dedicated model-testing team within Market Risk works with the risk managers to: • ... -
Page 329
... of Scotland plc National Westminster Bank Plc RBS Securities Inc RBS Financial Products Inc The Royal Bank of Scotland N.V. Clean - 1 - - 1 - 1 - - 1 Green Green Green Green Green Key points • Statistically the Group would expect to see back-testing exceptions 1% of the time over a one-year... -
Page 330
... used for certain unobserved parameters in pricing models. Missing basis risks: to cover cases where data sources are not detailed enough to differentiate the risks of long and short pairs of closely related instruments. Key point • The Group's period end SVaR declined in 2013 compared with 2012... -
Page 331
... and position-based risk measures. Sensitivity measures refer to the changes in deal or portfolio value that result from small changes in market parameters that are subject to the Group market risk limit framework. Position-based measures are also used and are stated in terms that relate directly to... -
Page 332
... to calculate its regulatory market risk capital requirement for the trading book for those legal entities under its jurisdiction. These legal entities are The Royal Bank of Scotland plc, RBS Securities Inc, RBS Financial Products Inc, and National Westminster Bank Plc. While internal VaR provides... -
Page 333
... and rating changes on the market value of bonds, credit derivatives and other related positions held in the trading book. It also captures basis risks between different instruments, different product maturities and different but related reference entities. Like the internal ratings-based approach... -
Page 334
... review Risk and balance sheet management Market risk continued Traded market risk continued Market risk capital* Minimum capital requirements The following table analyses the market risk minimum capital requirement, calculated in accordance with Basel 2.5. 2013 £m 2012 £m 2011 £m Interest rate... -
Page 335
... above are in capital terms. Key points • The Group's IRC was approximately £23 million or 6% higher at 31 December 2013 than one year previously. This rise was primarily due to increased delta trading activity during the year, with significant growth in positions in BBB-rated sovereign issuers... -
Page 336
... key categories: non-traded interest rate risk; non-traded foreign exchange risk; and non-traded equity risk. Non-traded market risk positions are reported on a regular basis to divisional Asset and Liability Management Committees (ALCOs) and monthly to the Group Balance Sheet Management Committee... -
Page 337
...-at-risk The Group's standard VaR metrics - which assume a time horizon of one trading day and a confidence level of 99% - are based on interest rate repricing gaps at the reporting date. Daily rate moves are modelled using observations over the last 500 business days. These incorporate customer... -
Page 338
Business review Risk and balance sheet management Market risk continued Non-traded market risk continued The following table shows the sensitivity of net interest income, over the next 12 months, to an immediate upward or downward change of 100 basis points to all interest rates. In addition, the ... -
Page 339
... managed by Group Treasury, relating to the main UK banking divisions, except Wealth. The amount represents the incremental contribution of the hedge relative to LIBOR cash rates. Net interest income Product hedges UK Retail UK Corporate International Banking Total product hedges 2013 £m 2012... -
Page 340
... that market prices are not available, fair value is based on appropriate valuation techniques or management estimates. Refer to the table below for the balance sheet carrying value of the Group's non-traded book equity positions. 2013 £m 2012 £m 2011 £m Exchange-traded equity Private equity... -
Page 341
Business review Risk and balance sheet management VaR for selected AFS non-trading portfolios Available-for-sale portfolios in Markets and Non-Core, other than the structured credit portfolio, do not typically form part of the structural interest rate framework due to the short-term nature of the ... -
Page 342
...The structured credit portfolio is held in Non-Core. The risk in this portfolio is not managed using VaR because the Group believes this is not an appropriate tool for a non-trading book portfolio comprising illiquid debt securities. These assets are reported on a drawn notional and fair value basis... -
Page 343
Business review Risk and balance sheet management Country risk 342 342 342 342 342 343 343 343 344 344 345 Definition External environment Outlook Sources of risk Governance Risk management Risk measurement Risk mitigation Basis of reporting Definitions Country exposure 341 -
Page 344
... financing needs saw capital outflows, currency depreciation and stock market losses. In the second half of the year, investor concerns were heightened by the risk that the US federal debt ceiling increase would not be passed on time and that the government might delay debt payments. Short-term... -
Page 345
... risk/return performance together with reputational and regulatory risk. Countries Watchlisted Amber (refer to Risk monitoring, reporting and control below) are monitored closely. Appetite for countries Watchlisted Red is limited to short-term business in areas such as trade finance and derivatives... -
Page 346
Business review Risk and balance sheet management Country risk continued Basis of reporting The tables in this section show the Group's exposure at 31 December 2013, 2012 and 2011. The numbers are reported by country of operation of the obligor, except exposures to governments and individuals which... -
Page 347
Business review Risk and balance sheet management Country exposure Summary of country exposures Lending Central Govt 2013 £m banks £m Other banks £m Other FI Corporate Personal £m £m £m Total lending £m Debt securities AFS & LAR £m HFT Net SFT £m Balance sheet £m (net) Derivatives £m £m... -
Page 348
Business review Risk and balance sheet management Country risk continued Country exposure continued Lending Central Govt 2012 £m banks £m Other banks £m Other FI Corporate Personal £m £m £m Total lending £m Debt securities AFS & LAR £m HFT Net SFT £m Balance sheet £m (net) Derivatives £m... -
Page 349
... Group's country risk exposure was in International Banking (primarily trade facilities, other lending and off-balance sheet exposure to corporates and financial institutions); Markets (principally derivatives and securities financing transactions with financial institutions, and HFT debt securities... -
Page 350
...in exposure to £5.2 billion reflected reductions in lending and derivatives to corporate clients. Net HFT debt exposure fluctuates as the Group is a market-maker in Italian government bonds. Off-balance sheet exposure to corporates and non-bank financial institutions also declined, by £0.7 billion... -
Page 351
Business review Risk and balance sheet management Ireland AFS and LAR debt 2013 Lending £m REIL Provisions £m £m securities £m AFS reserves £m HFT debt securities Long £m Short £m Total debt securities £m Net Derivatives £m SFT £m Balance sheet £m Offbalance sheet £m Total exposure £m ... -
Page 352
Business review Risk and balance sheet management Country risk continued Country exposure continued Spain AFS and LAR debt 2013 Lending £m REIL Provisions £m £m securities £m AFS reserves £m HFT debt securities Long £m Short £m Total debt securities £m Net Derivatives £m SFT £m Balance ... -
Page 353
Business review Risk and balance sheet management Italy AFS and LAR debt 2013 Lending £m REIL Provisions £m £m securities £m AFS reserves £m HFT debt securities Long £m Short £m Total debt securities £m Net Derivatives £m SFT £m Balance sheet £m Offbalance sheet £m Total exposure £m ... -
Page 354
Business review Risk and balance sheet management Country risk continued Country exposure continued Portugal AFS and LAR debt 2013 Lending £m REIL Provisions £m £m securities £m AFS reserves £m HFT debt securities Long £m Short £m Total debt securities £m Net Derivatives £m SFT £m Balance... -
Page 355
Business review Risk and balance sheet management Greece AFS and LAR debt 2013 Lending £m REIL Provisions £m £m securities £m AFS reserves £m HFT debt securities Long £m Short £m Total debt securities £m Net Derivatives £m SFT £m Balance sheet £m Offbalance sheet £m Total exposure £m ... -
Page 356
Business review Risk and balance sheet management Other risks 355 356 358 360 361 362 363 364 Conduct risk Pension risk Operational risk Regulatory risk Reputational risk Business risk Strategic risk Developments in 2014 354 -
Page 357
... and non-public price sensitive information. Governance structure Effective conduct risk management is a commercial imperative for the Group: customers, clients and counterparties demand it as a precursor to building trust. It also reflects the developing regulatory environment in the UK, with the... -
Page 358
... and changes in legislation. Meanwhile, pension scheme assets vary with changes in interest rates, inflation expectations, credit spreads, exchange rates and equity and property prices. The Group is exposed to the risk that the market value of the schemes' assets - together with future returns and... -
Page 359
Business review Risk and balance sheet management Risk is also mitigated in other ways. In October 2006, the main scheme was closed to new employees. In November 2009, the Group confirmed that it was making changes to the main scheme and a number of other defined benefit schemes including the ... -
Page 360
... team and teams based in each business. The function plays a leadership role by providing a forward-looking, value-adding capability, working with the business to achieve a robust risk management culture across the bank. The Group Head of Operational Risk reports to the Group Chief Risk Officer... -
Page 361
... December 2013, events aligned with clients, products and business practices accounted for 99% of the losses (compared to 91% in 2012). The losses in this category were as a result of new conduct-related provisions, further increased provisions relating to Payment Protection Insurance, Interest Rate... -
Page 362
...the Board Risk Committee. • • Compliance with the requirements of the UK Corporate Governance Code; Appropriateness of the risk frameworks, culture and governance structures of each division to help ensure the Group operates within risk appetite; Adequacy of reporting on the material risks for... -
Page 363
...also communicates information on regulatory developments and follow-up engagement with client-facing businesses and functions, helping them identify and execute any required mitigating changes to strategy or business models. The key regulatory policies are kept under annual review. Reputational risk... -
Page 364
Business review Risk and balance sheet management Other risks* continued Reputational risk continued The Board's oversight of reputational issues is supported by structures and committees to ensure that key reputational issues are discussed at appropriate levels across the Group: • The monthly ... -
Page 365
... term. Governance structure The Group's strategic planning process is managed by Group Strategy and Corporate Finance. As part of that process, each division develops a strategic plan for its business within a framework set by the Group's senior management. Divisional plans are then consolidated... -
Page 366
..." review of key dimensions of its strategy at a Group Board meeting at different points during the year. Risk management and measurement The Group seeks to reduce strategic risk by employing a disciplined strategic framework based on five enduring tests (leading customer franchises, returns, risk... -
Page 367
...29 Structured entities 30 Asset transfers 31 Capital resources 32 Memorandum items 33 Net cash (outflow)/inflow from operating activities 34 Analysis of the net investment in business interests and intangible assets 35 Interest received and paid 36 Analysis of changes in financing during the year 37... -
Page 368
... year ended 31 December 2013, the related Notes 1 to 42 on the consolidated financial statements, the related Notes 1 to 16 on the company financial statements and the information identified as "audited" in the Risk and balance sheet management section of the Business review. The financial reporting... -
Page 369
... to be made of the value of collateral assets in illiquid markets. In November 2013 the Group announced the transfer of approximately £38 billion of assets, predominantly loans, held in Ulster Bank, Non-Core, UK Corporate and International Banking into the RBS Capital Restructuring Group ("RCR") on... -
Page 370
Independent auditor's report to the members of The Royal Bank of Scotland Group plc Our assessment of the risks of material misstatement The assessment of the appropriateness of the carrying value of deferred taxation, goodwill, and other intangible assets, is highly judgemental as these valuations... -
Page 371
... the Listing Rules we are also required to review the part of the Corporate governance statement relating to the company's compliance with nine provisions of the UK Corporate Governance Code. We have nothing to report arising from our review. Our duty to read other information in the Annual Report... -
Page 372
Consolidated income statement for the year ended 31 December 2013 Note 2013 £m 2012* £m 2011* £m Interest receivable Interest payable Net interest income Fees and commissions receivable Fees and commissions payable Income from trading activities Gain on redemption of own debt Other operating... -
Page 373
... statement of comprehensive income for the year ended 31 December 2013 Note 2013 £m 2012* £m 2011* £m Loss for the year Items that do not qualify for reclassification Actuarial gains/(losses) on defined benefit plans Tax Items that do qualify for reclassification Available-for-sale financial... -
Page 374
... Equity shares Settlement balances Derivatives Intangible assets Property, plant and equipment Deferred tax Prepayments, accrued income and other assets Assets of disposal groups Total assets Liabilities Deposits by banks Customer accounts Debt securities in issue Settlement balances Short positions... -
Page 375
... statement of changes in equity for the year ended 31 December 2013 2013 £m 2012* £m 2011* £m Called-up share capital At 1 January Ordinary shares issued Share capital sub-division and consolidation At 31 December Paid-in equity At 1 January and 31 December (1) Share premium account... -
Page 376
... of changes in equity for the year ended 31 December 2013 2013 £m 2012* £m 2011* £m Foreign exchange reserve At 1 January Retranslation of net assets Foreign currency gains/(losses) on hedges of net assets Tax Transfer to retained earnings Recycled to profit or loss on disposal of businesses... -
Page 377
... - discontinued operations Dividends paid Movements in available-for-sale securities - unrealised gains - realised losses - tax - recycled to profit or loss on disposal of businesses (3) Equity raised Equity withdrawn and disposals Transfer from retained earnings At 31 December Total equity at 31... -
Page 378
... exchange differences Other non-cash items Net cash flows from trading activities Changes in operating assets and liabilities Net cash flows from operating activities before tax Income taxes paid Net cash flows from operating activities Investing activities Sale and maturity of securities Purchase... -
Page 379
...the net pension liability or asset at the long-term bond rate; and all past service costs to be recognised immediately when a scheme is curtailed or amended. Implementation of IAS 19 resulted in an increase in the loss after tax of £84 million for the year ended 31 December 2012 (2011 £154 million... -
Page 380
... actuarial basis using the projected unit credit method and discounted at a rate determined by reference to market yields at the end of the reporting period on high quality corporate bonds of equivalent term and currency to the scheme liabilities. Scheme assets are measured at their fair value. The... -
Page 381
Accounting policies The charge to profit or loss for pension costs (recorded in operating expenses) comprises: the current service cost interest, computed at the rate used to discount scheme liabilities, on the net defined benefit liability or asset past service cost resulting from a scheme ... -
Page 382
...the foreign exchange rates ruling at the dates the values are determined. Translation differences arising on non-monetary items measured at fair value are recognised in profit or loss except for differences arising on available-for-sale non-monetary financial assets, for example equity shares, which... -
Page 383
... and the Group has the positive intention and ability to hold to maturity. Held-to-maturity investments are initially recognised at fair value plus directly related transaction costs. They are subsequently measured at amortised cost using the effective interest method (see Accounting policy 3) less... -
Page 384
... (see Accounting policy 24). Other changes in the fair value of available-for-sale financial assets and any related tax are reported in other comprehensive income until disposal, when the cumulative gain or loss is reclassified from equity to profit or loss. Reclassifications - held-for-trading and... -
Page 385
...place within 60 - 180 days, the typical time frames from initial impairment to write off for the Group's collectively-assessed portfolios are: Financial assets carried at fair value - when a decline in the fair value of a financial asset classified as available-for-sale has been recognised directly... -
Page 386
... obligation to return the securities to the stock lending counterparty is recorded. 22. Netting Financial assets and financial liabilities are offset and the net amount presented in the balance sheet when, and only when, the Group currently has a legally enforceable right to set off the recognised... -
Page 387
..., at fair value. The Group's approach to determining the fair value of financial instruments is set out in the section of Critical accounting policies and key sources of estimation uncertainty entitled Fair value - financial instruments; further details are given in Note 11. A derivative embedded in... -
Page 388
... affect its reported results. Pensions The Group operates a number of defined benefit pension schemes as described in Note 4 on the accounts. The assets of the schemes are measured at their fair value at the balance sheet date. Scheme liabilities are measured using the projected unit credit method... -
Page 389
...will be received. Payment Protection Insurance - the Group has established a provision for redress payable in respect of the mis-selling of Payment Protection Insurance policies. The provision is management's best estimate of the anticipated costs of redress and related administration expenses. The... -
Page 390
... portfolio before it is identified and reported as such. Fair value - financial instruments Financial instruments classified as held-for-trading or designated as at fair value through profit or loss and financial assets classified as available-for-sale are recognised in the financial statements... -
Page 391
.... Equity securities (held-for-trading, designated as at fair value though profit or loss and available-for-sale) - comprise equity shares of companies or corporations both listed and unlisted. Deposits by banks and customer accounts (held-for-trading and designated as at fair value though profit or... -
Page 392
Accounting policies Effective after 2014 IAS 19 'Defined Benefit Plans: Employee Contributions' was issued in November 2013. This amendment distinguishes the accounting for employee contributions that are related to service from those that are independent of service. It is effective for annual ... -
Page 393
... accounts 1 Net interest income 2013 £m 2012 £m 2011 £m Loans and advances to customers Loans and advances to banks Debt securities Interest receivable Customer accounts: demand deposits Customer accounts: savings deposits Customer accounts: other time deposits Deposits by banks Debt securities... -
Page 394
Notes on the consolidated accounts 2 Non-interest income Fees and commissions receivable Payment services Credit and debit card fees Lending (credit facilities) Brokerage Trade finance Investment management Other 2013 £m 2012 £m 2011 £m 1,432 1,078 1,377 479 300 450 344 5,460 1,368 1,088 1,... -
Page 395
... detail below. Bank levy The UK bank levy was charged at a rate of 0.13% on chargeable liabilities in excess of £20 billion, and amounted to £200 million for 2013 (2012 - 0.088%, £175 million; 2011 - average 0.075%, £300 million). Payment Protection Insurance (PPI) To reflect current experience... -
Page 396
...the consolidated accounts 3 Operating expenses continued The Group expects to complete its review of sales of IRHP and provide basic redress to all customers who are entitled to it by the end of 2014. On 23 October 2013, the Group announced that it would split redress payments for all customers who... -
Page 397
...number of persons employed in the continuing operations of the Group at 31 December, excluding temporary staff, were as follows: 2013 2012 2011 UK Retail UK Corporate Wealth International Banking Ulster Bank US Retail & Commercial Retail & Commercial Markets Central items Non-Core Business Services... -
Page 398
... The market value of awards exercised in 2013 was £6 million (2012 - £45 million; 2011 - £11 million). Long-term incentives 2013 Value at grant £m Shares awarded (million) Options over shares (million) Value at grant £m 2012 Shares awarded (million) Options over shares (million) Value at grant... -
Page 399
... on equity shares; and a risk-free interest rate determined from the UK gilt rates with terms matching the expected lives of the options. Variable compensation awards The following tables analyse the Group and Markets variable compensation awards for 2013 (1). Group 2013 £m 2012 £m Change % 2013... -
Page 400
Notes on the consolidated accounts 4 Pensions The Group sponsors a number of pension schemes in the UK and overseas whose assets are independent of the Group's finances. The Royal Bank of Scotland Group Pension Fund (the "Main scheme") operates under UK trust law and is managed and administered on ... -
Page 401
...high quality' corporate bonds. The sterling yield curve (applied to 92% of the Group's defined benefit obligations) is constructed by reference to yields on 'AA' corporate bonds from which a single discount rate is derived based on a cash flow profile similar in structure and duration to the pension... -
Page 402
... market bid/offer spreads. The majority of swaps are with The Royal Bank of Scotland plc and National Westminster Bank Plc (the "banks"). At 31 December 2013, the gross notional value of the swaps was £31,664 million (2012 - £28,541 million; 2011 - £22,918 million) and had a net positive fair... -
Page 403
... value of defined benefit obligation £m Fair value of plan assets £m All schemes Present value of defined benefit obligation £m Changes in value of net pension deficit* At 1 January 2012 Currency translation and other adjustments Income statement Expected return Interest cost Current service... -
Page 404
... £m 2009* £m 2013 £m 2012* £m 2011* £m 2010* £m 2009* £m History of defined benefit schemes Fair value of plan assets Present value of defined benefit obligations Net deficit Experience gains/(losses) on plan liabilities Experience gains on plan assets Actual return on pension schemes assets... -
Page 405
... consolidated accounts The table below sets out the sensitivities of the pension cost for the year and the present value of defined benefit obligations at 31 December to a change in the principal actuarial assumptions: Main scheme (Decrease)/increase in pension cost for year 2013 £m 2012 £m 2011... -
Page 406
...UK corporation tax of 23.25% (2012 - 24.5%; 2011 - 26.5%) as follows: 2013 £m 2012* £m 2011* £m Expected tax credit Sovereign debt impairment where no deferred tax asset recognised Other losses in year where no deferred tax asset recognised Foreign profits taxed at other rates UK tax rate change... -
Page 407
... did not pay an ordinary dividend in 2013, 2012 or 2011. 9 Earnings per ordinary and equivalent B share Earnings per ordinary and equivalent B share have been calculated based on the following: 2013 £m 2012* £m 2011* £m Earnings Loss attributable to ordinary and B shareholders (Profit)/loss from... -
Page 408
... tax Prepayments, accrued income and other assets Assets of disposal groups 452,103 Liabilities Deposits by banks - repos - other (3) Customer accounts - repos - other (4) Debt securities in issue (5) Settlement balances Short positions Derivatives Accruals, deferred income and other liabilities... -
Page 409
... tax Prepayments, accrued income and other assets Assets of disposal groups 666,458 Liabilities Deposits by banks - repos - other (3) Customer accounts - repos - other (4) Debt securities in issue (5) Settlement balances Short positions Derivatives Accruals, deferred income and other liabilities... -
Page 410
...Assets of disposal groups 763,326 Liabilities Deposits by banks - repos - other (3) Customer accounts - repos - other (4) Debt securities in issue (5) Settlement balances Short positions Derivatives Accruals, deferred income and other liabilities Retirement benefit liabilities Deferred tax Insurance... -
Page 411
Notes on the consolidated accounts Amounts included in the consolidated income statement: 2013 £m 2012 £m 2011 £m (Losses)/gains on financial assets/liabilities designated as at fair value through profit or loss (Losses)/gains on disposal or settlement of loans and receivables (113) (248) (2,... -
Page 412
...statement Carrying value £m Fair value £m Impairment (losses) /releases £m Amount that would have been recognised had reclassification not occurred £m Reduction/ (increase) in profit or loss as a result of reclassification £m Income £m 2013 Reclassified from HFT to LAR Loans Debt securities... -
Page 413
... income statement Carrying value £m Fair value £m Impairment releases/ (losses) £m Amount that would have been recognised had reclassification not occurred £m Reduction/ (increase) in profit or loss as a result of reclassification £m Income £m 2012 Reclassified from HFT to LAR Loans Debt... -
Page 414
... issues within the trading businesses and provides a ratification to the appropriateness of areas with high levels of residual valuation uncertainty. Committee members include the Group Finance Director, the Group Chief Accountant, the Group Head of Market Risk, the Markets Chief Financial Officer... -
Page 415
... readily available for equity shares listed on the world's major stock exchanges and for major indices on such shares. Commodity prices - many commodities are actively traded in spot and forward contracts and futures on exchanges in London, New York and other commercial centres. Price volatilities... -
Page 416
... the consolidated accounts 11 Financial instruments - valuation continued The Group uses consensus prices for the source of independent pricing for some instruments. The consensus service encompasses the equity, interest rate, currency, commodity, credit, property, fund and bond markets, providing... -
Page 417
... drive the exposures and the correlation between those factors. Potential future positive exposures arising from vanilla products (including interest rate and foreign exchange derivatives) are modelled using the Group's core counterparty risk systems. The majority of the Group's CVA held in relation... -
Page 418
...when pricing trades. For issued debt and structured notes this adjustment is based on debt issuance spreads above average inter-bank rates (at a range of tenors). Secondary senior debt issuance spreads are used in the calculation of the own credit adjustment applied to senior debt. The fair value of... -
Page 419
...held-for-trading (HFT), designated as at fair value through profit or loss (DFV) and derivative liabilities are set out below. Debt securities in issue (1) Subordinated Total £m liabilities DFV £m Total £m Derivatives £m Total £m Cumulative own credit adjustment (CR)/DR (1) 2013 2012 2011 HFT... -
Page 420
... Other Loans and advances to customers Reverse repos Derivative collateral Other Debt securities UK government US government Other government Corporate Financial institutions Of which ABS RMBS (1) CMBS (2) CDO (3) CLO (4) Other Equity shares Derivatives Foreign exchange Interest rate Credit Equities... -
Page 421
... CDO CLO Other Equity shares Total AFS assets Of which Core Non-Core 21.0 - 21.0 Liabilities Deposits by banks Repos Derivative collateral Other Customer accounts Repos Derivative collateral Other Debt securities in issue Short positions Derivatives Foreign exchange Interest rate Credit Equities and... -
Page 422
... Of which AFS debt securities Corporate Financial institutions Of which AFS ABS RMBS CDO CLO Other Equity shares Total AFS assets Liabilities Deposits by bank Customer accounts Debt securities in issue Short positions Derivatives Foreign exchange Interest rate Credit - other Equities and commodities... -
Page 423
... were transferred. (7) Level 1: valued using unadjusted quoted prices in active markets, for identical financial instruments. Examples include G10 government securities, listed equity shares, certain exchange-traded derivatives and certain US agency securities. Level 2: valued using techniques based... -
Page 424
... interest rates, foreign exchange rates or equity index levels. Level 3 (£bn) Financial instruments Assets Liabilities Valuation technique Unobservable inputs Range Low High Loans 0.5 0.2 Price based Discounted cash flow model (DCF) Price (2) Credit spreads (3) Recovery rates (4) Yield... -
Page 425
... level, for some products an element of judgment is required. The majority of the Group's financial instruments carried at fair value are classified as level 2: inputs are observable either directly (i.e. as a price) or indirectly (i.e. derived from prices). Active and inactive markets A key... -
Page 426
... may be available. Examples of these products would be vanilla interest rate swaps, foreign exchange swaps and liquid single name credit derivatives. Non-modelled products Non-modelled products are generally quoted on a price basis and can therefore be considered for each of the 3 levels. This is... -
Page 427
...respective securities, the underlying asset composition (including origination date, loan to value ratios, historic loss information and geographic location of the mortgages), the credit rating of the instrument, and any credit protection that the instrument may benefit from, such as insurance wraps... -
Page 428
...level 3. Other asset-backed and corporate debt securities Where observable market prices for a particular debt security are not available, the fair value will typically be determined with reference to observable market transactions in other related products, such as similar debt securities or credit... -
Page 429
... underlyings are typically unobservable with no market information on closely related assets available. Where no market for the correlation input exists, these inputs are based on historical time series. Interest rate and commodity derivatives Interest rate and commodity options provide a payout (or... -
Page 430
...Level 3 transfers Foreign exchange At and other 31 December £m £m Amounts recorded in the Income statement on balances at year end Unrealised £m Realised £m Assets FVTPL (3) Loans and advances - banks - customers Debt securities Equity shares Derivatives FVTPL assets AFS Debt securities Equity... -
Page 431
... £m Level 3 transfers In £m Out Purchases Issuances Settlements £m £m £m £m Sales £m Foreign exchange At and other 31 December £m £m Amounts recorded in the Income statement on balances at year end Unrealised £m Realised £m Assets FVTPL (3) Loans and advances - banks - customers Debt... -
Page 432
... Level 3 transfers In £m Out Purchases Issuances Settlements £m £m £m £m Sales £m Foreign exchange At and other 31 December £m £m Amounts recorded in the Income statement on balances at year end £m 2011 Assets FVTPL (3) Loans and advances - banks - customers Debt securities Equity shares... -
Page 433
...banks - other Loans and advances to customers UK Retail UK Corporate Wealth International Banking Ulster Bank US Retail & Commercial Markets and other Non-Core Total loans and advances to customers Of which: Performing Non-performing Debt securities Settlement balances Financial liabilities Deposits... -
Page 434
...by banks and customer accounts Fair values of deposits are estimated using discounted cash flow valuation techniques. Debt securities in issue and subordinated liabilities Fair values are determined using quoted prices where available or by reference to valuation techniques, adjusting for own credit... -
Page 435
...£m 2012 More than 12 months £m Total £m Less than 12 months £m 2011 More than 12 months £m Total £m Assets Cash and balances at central banks Loans and advances to banks Loans and advances to customers Debt securities Equity shares Settlement balances Derivatives Liabilities Deposits by banks... -
Page 436
... the consolidated accounts 12 Financial instruments - maturity analysis continued 2013 0-3 months £m 3-12 months £m 1-3 years £m 3-5 years £m 5-10 years £m 10-20 years £m Assets by contractual maturity Cash and balances at central banks Loans and advances to banks Debt securities Settlement... -
Page 437
Notes on the consolidated accounts 2012 0-3 months £m 3-12 months £m 1-3 years £m 3-5 years £m 5-10 years £m 10-20 years £m Assets by contractual maturity Cash and balances at central banks Loans and advances to banks Debt securities Settlement balances Total maturing assets Loans and ... -
Page 438
... the consolidated accounts 12 Financial instruments - maturity analysis continued 2011 0-3 months £m 3-12 months £m 1-3 years £m 3-5 years £m 5-10 years £m 10-20 years £m Assets by contractual maturity Cash and balances at central banks Loans and advances to banks Debt securities Settlement... -
Page 439
Notes on the consolidated accounts 13 Financial assets - impairments continued Impairment losses/(recoveries) charged to the income statement Loans and advances to customers Loans and advances to banks Debt securities Equity shares 2013 £m 2012 £m 2011 £m 8,427 (15) 8,412 20 - 20 8,432 5,292 ... -
Page 440
... interest rate risk, the hedged items are typically government bonds, large corporate fixed-rate loans, fixed rate finance leases, fixed rate medium-term notes or preference shares classified as debt. At 31 December 2013, fixed rate financial assets of £23 billion (2012 - £25 billion; 2011 - £33... -
Page 441
...flow hedging Interest rate contracts Net investment hedging Exchange rate contracts 55 38 6 32 148 148 2,390 1,602 4,854 1,276 3,985 1,445 2,086 2,587 3,779 4,488 3,550 4,288 Hedge ineffectiveness recognised in other operating income comprised: 2013 £m 2012 £m 2011 £m Fair value hedging (Losses... -
Page 442
Notes on the consolidated accounts 15 Debt securities Central and local government 2013 UK £m US £m Other £m Banks £m Other financial institutions £m Corporate £m Total £m Of which ABS (1) £m Held-for-trading Designated as at fair value through profit or loss Available-for-sale Loans and ... -
Page 443
Notes on the consolidated accounts The following table analyses the Group's available-for-sale debt securities and the related yield (based on weighted averages) by remaining maturity and issuer. Within 1 year 2013 Amount £m Yield % After 1 but within 5 years Amount £m Yield % After 5 but within ... -
Page 444
...equity shares was £87 million (2012 - £59 million; 2011 - £54 million). Unquoted equity investments whose fair value cannot be reliably measured are carried at cost and classified as available-for-sale financial assets. They include capital stock (redeemable at cost) in the Federal Home Loan Bank... -
Page 445
... the consolidated accounts 17 Intangible assets Core deposit intangibles £m Other purchased intangibles £m Internally generated software £m 2013 Goodwill £m Total £m Cost At 1 January Transfers to disposal groups Currency translation and other adjustments Additions Disposals and write-off... -
Page 446
...CGUs at 30 September 2013 were based on the value in use test, using management's latest five-year forecasts. The long-term growth rates have been based on respective country nominal GDP growth rates. The risk discount rates are based on observable market long-term government bond yields and average... -
Page 447
...consolidated accounts In the light of downward revisions to its forecast financial performance, goodwill attributable to International Banking (IB) was tested for impairment as at 31 December 2013: recoverable amount was its value in use and the discount rate used in the calculation of value in use... -
Page 448
... on investment properties Change in fair value of investment properties - continuing operations - discontinued operations Disposals and write-off of fully depreciated assets At 31 December Accumulated impairment, depreciation and amortisation At 1 January Transfers from/(to) disposal groups Currency... -
Page 449
...properties in locations where the market for such properties is active and transparent are categorised as level 2 (46%); otherwise investment property fair value measurements are categorised as level 3 (54%). Valuations were carried out by qualified surveyors who are members of the Royal Institution... -
Page 450
... the issued ordinary share capital of DLG. (a) Profit/(loss) from discontinued operations, net of tax 2013 £m 2012 £m 2011 £m Direct Line Group Net premium income Other income Total income Operating expenses Profit before insurance net claims and impairment losses Insurance net claims Impairment... -
Page 451
... and liabilities of disposal groups 2013 £m 2012 £m 2011 £m Assets of disposal groups Cash and balances at central banks Loans and advances to banks Loans and advances to customers Debt securities and equity shares Derivatives Intangible assets Settlement balances Property, plant and equipment... -
Page 452
... and corporate activities across the UK ('UK branch-based businesses'). (d) Direct Line Group assets and liabilities General insurance business assets and liabilities Loans and advances to banks Loans and advances to customers Debt securities and equity shares Derivatives Intangible assets Property... -
Page 453
Notes on the consolidated accounts 21 Short positions 2013 £m 2012 £m 2011 £m Debt securities - Government - Other issuers Equity shares Note: (1) All short positions are classified as held-for-trading. 24,661 3,102 259 28,022 23,551 3,429 611 27,591 32,895 6,164 1,980 41,039 22 Accruals, ... -
Page 454
... Interest Rate Hedging Products based on experience, having now agreed a substantial number of outcomes with the independent skilled person appointed to review all decisions. The provision includes redress that will be paid to customers, interest payable on customer redress, the cost to the Group of... -
Page 455
... below. 2013 £m 2012 £m 2011 £m UK tax losses carried forward - The Royal Bank of Scotland plc - UK branch of RBS N.V. - National Westminster Bank Plc - RBS Management Services (UK) Ltd Overseas tax losses carried forward - Ulster Bank Ireland - RBS Citizens Financial Group - RBS N.V. Australia... -
Page 456
... UK branch of RBS N.V. to The Royal Bank of Scotland plc. The UK branch tax losses attributable to credit market write-downs during the financial crisis were principally incurred between 2007 and 2009. The Royal Bank of Scotland plc reported a taxable profit in 2011 and tax losses in 2012 and 2013... -
Page 457
... Thereafter £m 212 - 45 - 257 Perpetual £m 2,302 11,971 9,530 2,970 26,773 Total £m 2011 - final redemption Sterling US dollar Euro Other £m 73 302 220 29 624 Currently 2012 £m 158 555 1,299 - 2,012 2013 £m 648 3,903 2,389 1,618 8,558 2014-2016 £m 453 1,793 4,296 1,261 7,803 2017-2021... -
Page 458
Notes on the consolidated accounts 24 Subordinated liabilities continued Dated loan capital The Royal Bank of Scotland Group plc US$750 million 5% subordinated notes (redeemed November 2013) (1) US$750 million 5% subordinated notes 2014 (1) US$250 million 5% subordinated notes 2014 (1) US$675 ... -
Page 459
... the consolidated accounts Dated loan capital continued The Royal Bank of Scotland plc continued CHF400 million 2.375% subordinated notes 2015 CHF100 million 2.375% subordinated notes 2015 (callable annually from November 2013) CHF200 million 2.375% subordinated notes 2015 US$229 million (2011 - US... -
Page 460
... Tier 2 341 373 - 211 60 221 360 410 - 217 63 199 371 400 261 - 64 136 Notes: (1) On-lent to The Royal Bank of Scotland plc on a subordinated basis. (2) Partially repurchased following completion of an exchange offer in March 2012 (3) In the event of certain changes in tax laws, dated loan capital... -
Page 461
Notes on the consolidated accounts Undated loan capital Capital treatment 2013 £m 2012 £m 2011 £m The Royal Bank of Scotland Group plc â,¬391 million floating rate 2042 (callable quarterly from June 2012) (2,3) US$486 million 6.8% 2042 (callable quarterly from March 2008) (2,4) US$318 million ... -
Page 462
... on all floating rate subordinated notes is calculated by reference to market rates. Preference shares Capital treatment 2013 £m 2012 £m 2011 £m The Royal Bank of Scotland Group plc (1) Non-cumulative preference shares of US$0.01 Series F US$156 million 7.65% (callable any time from March 2007... -
Page 463
... January 2012 Currency translation and other adjustments (Loss)/profit attributable to non-controlling interests - continuing operations - discontinued operations Losses on available-for-sale financial assets, net of tax Equity raised Equity withdrawn and disposals Transfer from retained earnings At... -
Page 464
... access share with a nominal value of £0.01; these shares were issued to HM Treasury on 22 December 2009. Net proceeds were £25.1 billion. The B shares do not generally carry voting rights at general meetings of ordinary shareholders. Following the subdivision and consolidation of ordinary shares... -
Page 465
Notes on the consolidated accounts Number of shares Redemption Interest rate date on or after Redemption price per share Debt/equity (1) Class of preference share Non-cumulative preference shares of US$0.01 Series F Series H Series L Series M Series N Series P Series Q Series R Series S Series T... -
Page 466
... of the company's paid up share capital. Contingent capital reserve - in December 2009, HM Treasury agreed to subscribe for up to 16 billion B shares of £0.01 each at 50p per share subject to certain conditions including the Group's Core Tier 1 capital ratio falling below 5%. The fair value of the... -
Page 467
... 2013 £m 2012 £m 2011 £m Nature of operating lease assets on the balance sheet Transportation Cars and light commercial vehicles Other 822 64 243 1,129 Amounts recognised as income and expense Finance leases - contingent rental income Operating leases - minimum rentals payable Finance lease... -
Page 468
Notes on the consolidated accounts 28 Leases continued Residual value exposures The table below gives details of the unguaranteed residual values included in the carrying value of finance lease receivables (see pages 419 to 423) and operating lease assets (see pages 462 to 464). Year in which ... -
Page 469
...: (1) Debt securities retained by the Group may be pledged with central banks. (2) Corporate, social housing and student loans. Commercial paper conduits The Group consolidates a number of asset-backed commercial paper (ABCP) conduits. A conduit is an SE that issues commercial paper and uses the... -
Page 470
... not sponsored £m 2013 Investment funds £m Other £m Total £m Held for trading Loans and advances to customers Debt securities Equity shares Derivatives assets Derivatives liabilities Total Other than held-for-trading Loans and advances to customers Debt securities Total Liquidity facilities... -
Page 471
... the securities issued by the trust. The value of the retained interest varies and is subject to credit, interest rate, prepayment, and other risks of the transferred assets. In the ordinary course of business, the Group does not provide any other financial support to the securitisation trusts other... -
Page 472
...the consolidated accounts 31 Capital resources The Group's regulatory capital resources in accordance with PRA definitions were as follows: 2013 £m 2012 £m 2011 £m Shareholders' equity (excluding non-controlling interests) Shareholders' equity Preference shares - equity Other equity instruments... -
Page 473
.... The PRA uses risk asset ratio (RAR) as a measure of capital adequacy in the UK banking sector, comparing a bank's capital resources with its risk-weighted assets (the assets and off-balance sheet exposures are 'weighted' to reflect the inherent credit and other risks); by international agreement... -
Page 474
... of credit, supporting customer debt issues and contingent liabilities relating to customer trading activities such as those arising from performance and customs bonds, warranties and indemnities. Commitments Commitments to lend - under a loan commitment the Group agrees to make funds available to... -
Page 475
... Group may hold or place assets on behalf of individuals, trusts, companies, pension schemes and others. The assets and their income are not included in the Group's financial statements. The Group earned fee income of £462 million (2012 - £476 million; 2011 - £502 million) from these activities... -
Page 476
... parties. Additionally, between March and July 2013, claims were issued in the High Court of Justice of England and Wales by sets of current and former shareholders, against the Group (and in one of those claims, also against certain former individual officers and directors) alleging that untrue and... -
Page 477
...class actions in which Group companies are defendants include New Jersey Carpenters Health Fund v. Novastar Mortgage Inc. et al. and In re IndyMac Mortgage-Backed Securities Litigation. A third MBS class action, New Jersey Carpenters Vacation Fund et al. v. The Royal Bank of Scotland plc et al., has... -
Page 478
...exchange market by manipulating benchmark foreign exchange rates. Madoff In December 2010, Irving Picard, as trustee for the bankruptcy estates of Bernard L. Madoff and Bernard L. Madoff Investment Securities LLC., filed a clawback claim against The Royal Bank of Scotland N.V. (RBS N.V.) in New York... -
Page 479
... review in relation to the sale of interest rate hedging products to some small and medium sized businesses who were classified as retail clients or private customers under FSA rules. On 31 January 2013, the FSA issued a report outlining the principles to which it wished the Group and other UK banks... -
Page 480
... this review at this stage. Card Protection Plan Limited On 22 August 2013, the FCA announced that Card Protection Plan Limited ("CPP") and 13 banks and credit card issuers, including the Group, had agreed to a compensation scheme in relation to the sale of card and/or identity protection insurance... -
Page 481
... secured agreement from the banks on four industry-wide initiatives designed to address its concerns, namely minimum standards on the operation of opt-outs from unarranged overdrafts, new working groups on information sharing with customers, best practice for PCA customers in financial difficulties... -
Page 482
... with ratings agencies, disclosure to investors, document deficiencies, trading activities and repurchase requests. On 7 November 2013, the Group announced that it had settled with the US Securities and Exchange Commission ('the SEC') over its investigation of RBS Securities Inc. relating to... -
Page 483
...) to address deficiencies related to governance, risk management and compliance systems and controls in RBS plc and RBS N.V. branches. In the Order, the Group agreed to create the following written plans or programmes: • a plan to strengthen board and senior management oversight of the corporate... -
Page 484
...US dollar payments. On 11 December 2013 the Group and The Royal Bank of Scotland plc announced that they had reached a settlement with the Board of Governors of the Federal Reserve System (Fed), the New York State Department of Financial Services (DFS), and the Office of Foreign Assets Control (OFAC... -
Page 485
... in deposits by banks and customers Decrease in insurance liabilities Decrease in debt securities in issue (Decrease)/increase in other liabilities (Decrease)/increase in derivative liabilities Increase/(decrease) in settlement balances and short positions Changes in operating liabilities Income... -
Page 486
... of subordinated liabilities Net cash inflow/(outflow) from financing Transfer to retained earnings Share capital sub-division and consolidation Ordinary shares issued in respect of employee share schemes Other adjustments including foreign exchange At 31 December *Restated 45,144 264 - - 264... -
Page 487
...342 million (2012 - £12,784 million; 2011 - £19,691 million). Certain members of the Group are required by law or regulation to maintain balances with the central banks in the jurisdictions in which they operate. These balances are set out below. 2013 2012 2011 Bank of England US Federal Reserve... -
Page 488
...'s trading and structuring teams to meet the client's objectives across financing, risk management, investment, securitisation and liquidity. A new strategy for the Markets division was announced in June 2013 enabling RBS to concentrate on its core customers' needs where the Markets business is... -
Page 489
... £m Operating profit/(loss) £m UK Retail UK Corporate Wealth International Banking Ulster Bank US Retail & Commercial Markets Central items Core Non-Core Managed basis Reconciling items Own credit adjustments Payment Protection Insurance costs Interest Rate Hedging Products redress and related... -
Page 490
... Operating profit/(loss) £m 2012* UK Retail UK Corporate Wealth International Banking Ulster Bank US Retail & Commercial Markets Central items Core Non-Core Managed basis Reconciling items Own credit adjustments Payment Protection Insurance costs Interest Rate Hedging Products redress and related... -
Page 491
... £m Operating profit/(loss) £m UK Retail UK Corporate Wealth International Banking Ulster Bank US Retail & Commercial Markets Central items Core Non-Core Managed basis Reconciling items Own credit adjustments Payment Protection Insurance costs Sovereign debt impairment and related interest rate... -
Page 492
... £m Total income UK Retail UK Corporate Wealth International Banking Ulster Bank US Retail & Commercial Markets Central items Core Non-Core Managed basis Reconciling items Own credit adjustments Integration and restructuring costs Gain on redemption of own debt Asset Protection Scheme Strategic... -
Page 493
... revenue UK Retail UK Corporate Wealth International Banking Ulster Bank US Retail & Commercial Markets Central items Core Non-Core Managed basis Reconciling items Own credit adjustments Integration and restructuring costs Gain on redemption of own debt Asset Protection Scheme Strategic disposals... -
Page 494
... accounts 38 Segmental analysis continued Segmental analysis of assets and liabilities included in disposal groups: 2013 Assets £m Liabilities £m 2012 Assets £m Liabilities £m 2011 Assets £m Liabilities £m UK Retail UK Corporate Wealth International Banking US Retail & Commercial Markets... -
Page 495
... basis of location of office where the transactions are recorded. UK £m USA £m Europe £m RoW £m Total £m 2013 Total revenue Net interest income Net fees and commissions Income from trading activities Other operating income Total income Operating (loss)/profit before tax Total assets Of which... -
Page 496
...: 2013 £000 2012 £000 Loans and advances to customers Customer accounts 10,750 33,279 11,748 36,250 Key management have banking relationships with Group entities which are entered into in the normal course of business and on substantially the same terms, including interest rates and security... -
Page 497
...Bank of England facilities The Group also participates in a number of schemes operated by the Bank of England available to eligible banks and building societies. At 31 December 2013, the Group had no debt outstanding guaranteed by the UK Government (2012 - nil; 2011 - £21.3 billion). National Loan... -
Page 498
... 1 January 2014 with a portfolio of £29 billion assets. Sale of selected Chicago-area operations of RBS Citizens On 7 January 2014, the Group announced that RBS Citizens Financial Group, Inc. had reached agreement to sell its Chicago-area retail branches, small business operations and select middle... -
Page 499
... £m 2012 £m 2011 £m Assets Loans and advances to banks Loans and advances to customers Debt securities Investments in Group undertakings Derivatives Prepayments, accrued income and other assets Assets of disposal groups Total assets Liabilities Deposits by banks Customer accounts Debt securities... -
Page 500
... and notes Statement of changes in equity for the year ended 31 December 2013 2013 £m 2012 £m 2011 £m Called-up share capital At 1 January Ordinary shares issued Share capital sub-division and consolidation At 31 December Paid-in equity At 1 January and 31 December Share premium account At... -
Page 501
... company financial statements and notes 2013 £m 2012 £m 2011 £m Retained earnings At 1 January Profit/(loss) attributable to ordinary and B shareholders and other equity owners Equity preference dividends paid Paid-in equity dividends paid, net of tax Transfer from merger reserve Transfer... -
Page 502
... of loans to Group entities Elimination of foreign exchange differences Other non-cash items Net cash flows from trading activities Changes in operating assets and liabilities Net cash flows from operating activities before tax Income taxes paid Net cash flows from operating activities Investing... -
Page 503
... comprehensive income. Condensed information is set out below. 2013 £m 2012 £m 2011 £m Income statement Dividends received from banking subsidiary Dividends received from other subsidiaries Profit on disposal of investment in subsidiaries Interest receivable from subsidiaries Interest payable to... -
Page 504
...accrued income and other assets - non-financial assets Assets of disposal groups Liabilities Deposits by banks (2) - amortised cost Customer accounts (2) - amortised cost Debt securities in issue - amortised cost - designated as at fair value through profit or loss Derivatives (2) - held-for-trading... -
Page 505
... balance sheet. 2013 Carrying value £bn Fair value (1) £bn 2012 Carrying value £bn Fair value £bn 2011 Carrying value £bn Fair value £bn Financial assets Loans and advances to banks Loans and advances to customers Debt securities Financial liabilities Deposits by banks Customer accounts Debt... -
Page 506
... follows: 2013 2012 Liabilities £m Assets £m Liabilities £m 2011 Assets £m Liabilities £m Fair value hedging Interest rate contracts Assets £m 104 37 291 - 279 - 7 Debt securities Debt securities comprise the partial repurchase of preferred securities issued by the trusts referred to... -
Page 507
... an accounting reference date of 31 December. Country of incorporation and principal area of operation Nature of business Group interest The Royal Bank of Scotland plc National Westminster Bank Plc (1) RBS Citizens Financial Group, Inc. Coutts & Company (2) RBS Securities Inc. Ulster Bank Limited... -
Page 508
... assets (Decrease)/increase in deposits by banks and customers (Decrease)/increase in debt securities in issue Increase/(decrease) in other liabilities Increase/(decrease) in derivative liabilities Changes in operating liabilities Income taxes paid Net cash (outflow)/inflow from operating activities... -
Page 509
Parent company financial statements and notes 13 Interest received and paid 2013 £m 2012 £m 2011 £m Interest received Interest paid 1,139 (884) 255 1,143 (723) 420 1,149 (642) 507 14 Analysis of changes in financing during the year Share capital, share premium, paid-in equity and merger ... -
Page 510
Additional information 509 519 520 520 521 521 523 Financial summary Exchange rates Supervision Description of property and equipment Major shareholders Material contracts Risk factors 508 -
Page 511
...) Summary consolidated balance sheet Loans and advances Debt securities and equity shares Derivatives and settlement balances Other assets Total assets Owners' equity Non-controlling interests Subordinated liabilities Deposits Derivatives, settlement balances and short positions Other liabilities... -
Page 512
... operations - pence (1) Share price per ordinary share at year end - £ Market capitalisation at year end - £bn Net asset value per ordinary and equivalent B share - £ Return on average total assets (2) Return on average owners equity (3) Return on average ordinary and B shareholders' equity... -
Page 513
... maturity, geographical (location of office) area and type of customer. Within 1 year £m After 1 year but within 5 years £m After 5 years £m 2013 Total £m 2012 £m 2011 £m 2010 £m 2009 £m UK Central and local government Finance Residential mortgages Personal lending Property Construction... -
Page 514
...'Critical accounting policies and key sources of estimation uncertainty' on pages 386 to 389. The following table shows the movements in loan impairment provisions. 2013 £m 2012 £m 2011 £m 2010 £m 2009 £m Provisions at the beginning of the year UK Overseas Transfer (to)/from disposal groups UK... -
Page 515
Additional information 2013 2012 2011 2010 2009 Closing customer provisions as a % of gross loans and advances to customers (3, 4) UK Overseas Total Customer charge to income statement as a % of gross loans and advances to customers (3, 4) UK Overseas Total 1.3% 3.7% 2.0% 0.8% 2.1% 1.2% 1.0% ... -
Page 516
... geographical area and type of UK customer. 2013 £m 2012 £m 2011 £m 2010 £m 2009 £m UK Manufacturing Construction Finance Service industries and business activities Property Residential mortgages Personal lending Finance leases and instalment credit Total UK Overseas Total recoveries 1 1 - 21... -
Page 517
... is established for the latter. 2013 £m 2012 £m 2011 £m 2010 £m 2009 £m Impaired loans (1) UK Overseas Total Accruing loans which are contractually overdue 90 days or more as to principal or interest UK Overseas Total Total risk elements in lending Closing provisions for impairment as a % of... -
Page 518
... are loans and advances including finance leases and instalment credit receivables and other monetary assets, such as debt securities, including non-local currency claims of overseas offices on local residents. The Group monitors the geographical breakdown of these exposures based on the country of... -
Page 519
... information Analysis of deposits - product analysis The following table analyses the Group's deposits, excluding repos, by type and geographical area (location of office). 2013 £m 2012 £m 2011 £m UK Demand deposits - interest-free - interest-bearing Time deposits - savings - other Total UK... -
Page 520
... and 2011 - £1 billion). Balances are generally based on monthly data. Average interest rates during the year are computed by dividing total interest expense by the average amount borrowed. Average interest rates at year end are average rates for a single day and as such may reflect one-day market... -
Page 521
... transfers in sterling as certified for customs purposes by the Federal Reserve Bank of New York. US dollars per £1 Noon Buying Rate High Low 1.6612 1.6335 1.6574 1.6254 2013 January 2014 December 2013 November 2013 October 2013 September 2013 August 2013 1.6373 1.5916 2012 1.6224 1.5904 2011... -
Page 522
... in the Group's Markets, International Banking and UK Corporate Banking divisions, and are undertaken under the names of The Royal Bank of Scotland plc and National Westminster Bank Plc. UK retail banking activities are managed by the UK Retail division and by Ulster Bank Limited in Northern... -
Page 523
...RBS Holdings N.V.). The CSA (as amended and restated) details, inter alia, the equity interests in RFS Holdings, the governance of RFS Holdings, the arrangements for the transfer of certain ABN AMRO businesses, assets and liabilities to the Dutch State (previously Fortis Bank Nederland), the company... -
Page 524
...Sale of RBS England & Wales and NatWest Scotland branch based business On 27 September 2013, the Group agreed a £600 million pre-IPO investment with a consortium of investors led by Corsair Capital and Centerbridge Partners, in relation to its RBS England and Wales and NatWest Scotland branch based... -
Page 525
... plan approved by the EC. During 2012 the Group implemented changes to its wholesale banking operations, including the reorganisation of its wholesale businesses and the exit and downsizing of selected existing activities (including cash equities, corporate banking, equity capital markets... -
Page 526
...Director and Chief Risk Officer and its newly appointed Group Finance Director (October 2013) resigned and a search for a new Group Finance Director is continuing. The Group's changing strategy, particularly with respect to its Markets business and recently announced disposition of RBS Citizens, has... -
Page 527
...are unwound. The Group's businesses and performance are also affected by financial market conditions. Capital and credit markets around the world have been relatively stable since 2012. Although the risk of sovereign default relating to certain EU member states diminished during 2013, a number of EU... -
Page 528
..., the Group, together with HM Treasury, agreed the terms of a restructuring plan. result in significant market dislocation; heighten counterparty risk; result in downgrades of credit ratings for European borrowers, giving rise to increases in credit spreads and decreases in security values... -
Page 529
... including the disposal of a number of businesses now completed, the disposal of Direct Line Group (DLG) and the disposal of the Royal Bank branchbased business in England and Wales and the National Westminster Bank Plc (NatWest) branches in Scotland, along with the direct and other small and medium... -
Page 530
...an additional CET1 capital requirement, depending on a bank's systemic importance. The Group has been identified by the Financial Stability Board (FSB) as a GSIB. The FSB list of GSIBs is updated annually, based on new data and changes to methodology. The November 2013 update placed the Group in the... -
Page 531
...on its financial condition and regulatory capital position. The Group's borrowing costs, its access to the debt capital markets and its liquidity depend significantly on its and the UK Government's credit ratings The credit ratings of RBSG, RBS and other Group members have been subject to change and... -
Page 532
... market to be riskier have had to issue debt at a premium. Any uncertainty regarding the perception of credit risk across financial institutions may lead to reductions in levels of interbank lending and associated term maturities and may restrict the Group's access to traditional sources of funding... -
Page 533
...; changes to financial reporting standards (including accounting standards), corporate governance requirements, corporate structures and conduct of business rules; the imposition of restrictions on the Group's ability to compensate its senior management and other employees; regulations relating to... -
Page 534
... Group's corporate structure, its business activities conducted in the UK and the US and potentially other jurisdictions where the Group operates, as well as changes to the Group's business model, are likely to be required. The changes include ring-fencing certain core banking activities in the UK... -
Page 535
... where it does business. The proper functioning of the Group's payment systems, financial and sanctions controls, risk management, credit analysis and reporting, accounting, customer service and other information technology systems, as well as the communication networks between its branches and main... -
Page 536
...the value of pension fund assets is not sufficient to cover potential obligations The Group maintains a number of defined benefit pension schemes for past and a number of current employees. Pension risk is the risk that the assets of the Group's various defined benefit pension schemes which are long... -
Page 537
... the reported earnings of the Group's non-UK subsidiaries and may affect the Group's reported consolidated financial condition or its income from foreign exchange dealing. For accounting purposes, the Group values some of its issued debt, such as debt securities, at the current market price. Factors... -
Page 538
...fair value through profit or loss; (ii) financial assets classified as available-for-sale; and (iii) derivatives. Generally, to establish the fair value of these instruments, the Group relies on quoted market prices or, where the market for a financial instrument is not sufficiently active, internal... -
Page 539
... Analyses of ordinary shareholders Trading market Dividend history Taxation for US Holders Exchange controls Memorandum and Articles of Association Incorporation and registration Abbreviations and acronyms Glossary of terms EDTF recommendations Index Important addresses Principal offices 537 -
Page 540
... sign-up - choose to receive email notification when your shareholder communications become available instead of paper communications; outstanding payments - reissue any uncashed payments using our online replacement service; and downloadable forms - including stock transfer and change of address... -
Page 541
...fraudsters you should contact Action Fraud on 0300 123 2040. Analyses of ordinary shareholders Number of shares - millions At 31 December 2013 Shareholdings % Individuals Banks and nominee companies Investment trusts Insurance companies Other companies Pension trusts Other corporate bodies 200... -
Page 542
...The Bank of New York Mellon, as depository, and all owners and holders from time to time of ADSs issued thereunder. The ordinary shares of the company are listed and traded on the London Stock Exchange. All ordinary shares are deposited with the principal London office of The Bank of New York Mellon... -
Page 543
Shareholder information The following table shows, for the periods indicated, the high and low sales prices for each of the outstanding ADSs representing non-cumulative dollar preference shares and PROs, as reported on the NYSE or NASDAQ. Figures in US$ Series F ADSs Series H ADSs Series L ADSs ... -
Page 544
... information Trading market continued Ordinary shares The following table shows, for the periods indicated, the high and low sales prices for the company's ordinary shares, as derived from the Daily Official List of the London Stock Exchange. Following the sub-division and one-for-ten consolidation... -
Page 545
... 2011 and ended on 1 April 2013. On 4 May 2012, RBS determined that it was in a position to recommence payments on RBS Group instruments. In June 2013 RBS Holdings N.V. resumed payments on its hybrid capital instruments. Future coupons and dividends on hybrid capital instruments will only be paid... -
Page 546
... of the voting stock of the company, nor does this summary address all of the tax consequences to US Holders subject to special rules, such as certain financial institutions, dealers or traders in securities who use a mark-to-market method of tax accounting, persons holding ordinary shares, ordinary... -
Page 547
... of the dividend. The amount of any dividend paid in pounds sterling to be included in income by a US Holder will be the US dollar amount calculated by reference to the relevant exchange rate in effect on the date of such receipt regardless of whether the payment is in fact converted into US dollars... -
Page 548
... times listed on a 'recognised stock exchange' within the meaning of section 1005 of the Income Tax Act 2007, such as the main market of the New York Stock Exchange. In all other cases, an amount must be withheld on account of UK income tax at the basic rate (currently 20%) subject to any direction... -
Page 549
...the UK or from the Group's website (rbs.com). Incorporation and registration The company was incorporated and registered in Scotland under the Companies Act 1948 as a limited company on 25 March 1968 under the name National and Commercial Banking Group Limited, and changed its name to The Royal Bank... -
Page 550
... Rate Risk in the Banking Book International Swaps and Derivatives Association Loans and Receivables Loss Given Default London Interbank Offered Rate Long Term Incentive Plan Loan-to-value Mortgage-backed Securities Medium-term Notes Northern Ireland New York Stock Exchange Office of Fair Trading... -
Page 551
..., credit scores and defaults based on portfolio trends. Commercial mortgage backed securities (CMBS) - asset-backed securities for which the underlying asset portfolios are loans secured on commercial real estate. Commercial paper (CP) - unsecured obligations issued by a corporate or a bank directly... -
Page 552
... upon a defined credit event in relation to a reference financial asset or portfolio of financial assets. Credit events usually include bankruptcy, payment default and rating downgrades. Credit derivative product company (CDPC) - a structured entity that sells credit protection under credit default... -
Page 553
...usually impacts the transferability of the asset and can restrict its free use until the encumbrance is removed. Equity risk - the risk of changes in the market price of the equities or equity instruments arising from positions, either long or short, in equities or equity-based financial instruments... -
Page 554
... assets in the Group's trading portfolios. Interest payable on these financial liabilities is charged to the trading book. International Accounting Standards Board (IASB) - the independent standard-setting body of the IFRS Foundation. Its members are responsible for the development and publication... -
Page 555
... terms Level 1 - level 1 fair value measurements are derived from quoted prices (unadjusted) in active markets for identical assets or liabilities that the entity can access at the measurement date. Level 2 - level 2 fair value measurements use inputs, other than quoted prices included within Level... -
Page 556
... exchange traded derivatives that have standardised terms and conditions. Own credit adjustment (OCA) - the effect of the Group's own credit standing on the fair value of financial liabilities. Past due - a financial asset such as a loan is past due when the counterparty has failed to make a payment... -
Page 557
...-risk (SVaR) - a VaR measure using historical data from a one year period of stressed market conditions. For the purposes of calculating regulatory SVaR, a time horizon of ten trading days is assumed at a confidence level of 99%. (refer to Value-at-risk definition below). Structured credit portfolio... -
Page 558
...including, the Government National Mortgage Association, issue or guarantee publicly traded debt securities. Value-at-risk (VaR) - a technique that produces estimates of the potential loss in the market value of a portfolio over a specified time period at a given confidence level. Wholesale funding... -
Page 559
...funding, credit risk and market risk. The Group implemented the majority of the EDTF recommendations in its 2012 Annual Report and Accounts and Pillar 3 Report and the remainder in its 2013 reports. The table below sets out the EDTF recommendations and the related locations in the 2013 Annual Report... -
Page 560
... 366 Corporate governance Compliance report Governance at a glance Risk management The Board and its committees Debt securities Risk and balance sheet management Notes on the consolidated accounts Parent company notes Deposits Customer accounts Deposits by banks Derivatives Risk and balance sheet... -
Page 561
... Income statement Business review Consolidated Parent company Insurance claims Accounting polices Insurance premium income Accounting policies Intangible assets Accounting policies Segmental analysis of goodwill Notes on the consolidated accounts Interest Rate Hedging Products redress and related... -
Page 562
... policies Additional information Notes on the consolidated accounts RBS Capital Resolution (RCR) Related parties Risk and balance sheet management Balance sheet analysis Capital management Country risk Credit risk Liquidity and funding risk Market risk Other risks Risk appetite Risk governance Risk... -
Page 563
... offices The Royal Bank of Scotland Group plc PO Box 1000 Gogarburn Edinburgh EH12 1HQ Telephone: +44 (0)131 626 0000 The Royal Bank of Scotland plc PO Box 1000 Gogarburn Edinburgh EH12 1HQ 280 Bishopsgate London EC2M 4RB National Westminster Bank Plc 135 Bishopsgate London EC2M 3UR RBS Citizens RBS... -
Page 564
The Royal Bank of Scotland Group plc Group Headquarters PO Box 1000 Gogarburn Edinburgh EH12 1HQ