RBS 2013 Annual Report Download - page 398
Download and view the complete annual report
Please find page 398 of the 2013 RBS annual report below. You can navigate through the pages in the report by either clicking on the pages listed below, or by using the keyword search tool below to find specific information within the annual report.-
 1
1 -
2
-
3
-
4
-
5
-
6
-
7
-
8
-
9
-
10
-
11
-
12
-
13
-
14
-
15
-
16
-
17
-
18
-
19
-
20
-
21
-
22
-
23
-
24
-
25
-
26
-
27
-
28
-
29
-
30
-
31
-
32
-
33
-
34
-
35
-
36
-
37
-
38
-
39
-
40
-
41
-
42
-
43
-
44
-
45
-
46
-
47
-
48
-
49
-
50
-
51
-
52
-
53
-
54
-
55
-
56
-
57
-
58
-
59
-
60
-
61
-
62
-
63
-
64
-
65
-
66
-
67
-
68
-
69
-
70
-
71
-
72
-
73
-
74
-
75
-
76
-
77
-
78
-
79
-
80
-
81
-
82
-
83
-
84
-
85
-
86
-
87
-
88
-
89
-
90
-
91
-
92
-
93
-
94
-
95
-
96
-
97
-
98
-
99
-
100
-
101
-
102
-
103
-
104
-
105
-
106
-
107
-
108
-
109
-
110
-
111
-
112
-
113
-
114
-
115
-
116
-
117
-
118
-
119
-
120
-
121
-
122
-
123
-
124
-
125
-
126
-
127
-
128
-
129
-
130
-
131
-
132
-
133
-
134
-
135
-
136
-
137
-
138
-
139
-
140
-
141
-
142
-
143
-
144
-
145
-
146
-
147
-
148
-
149
-
150
-
151
-
152
-
153
-
154
-
155
-
156
-
157
-
158
-
159
-
160
-
161
-
162
-
163
-
164
-
165
-
166
-
167
-
168
-
169
-
170
-
171
-
172
-
173
-
174
-
175
-
176
-
177
-
178
-
179
-
180
-
181
-
182
-
183
-
184
-
185
-
186
-
187
-
188
-
189
-
190
-
191
-
192
-
193
-
194
-
195
-
196
-
197
-
198
-
199
-
200
-
201
-
202
-
203
-
204
-
205
-
206
-
207
-
208
-
209
-
210
-
211
-
212
-
213
-
214
-
215
-
216
-
217
-
218
-
219
-
220
-
221
-
222
-
223
-
224
-
225
-
226
-
227
-
228
-
229
-
230
-
231
-
232
-
233
-
234
-
235
-
236
-
237
-
238
-
239
-
240
-
241
-
242
-
243
-
244
-
245
-
246
-
247
-
248
-
249
-
250
-
251
-
252
-
253
-
254
-
255
-
256
-
257
-
258
-
259
-
260
-
261
-
262
-
263
-
264
-
265
-
266
-
267
-
268
-
269
-
270
-
271
-
272
-
273
-
274
-
275
-
276
-
277
-
278
-
279
-
280
-
281
-
282
-
283
-
284
-
285
-
286
-
287
-
288
-
289
-
290
-
291
-
292
-
293
-
294
-
295
-
296
-
297
-
298
-
299
-
300
-
301
-
302
-
303
-
304
-
305
-
306
-
307
-
308
-
309
-
310
-
311
-
312
-
313
-
314
-
315
-
316
-
317
-
318
-
319
-
320
-
321
-
322
-
323
-
324
-
325
-
326
-
327
-
328
-
329
-
330
-
331
-
332
-
333
-
334
-
335
-
336
-
337
-
338
-
339
-
340
-
341
-
342
-
343
-
344
-
345
-
346
-
347
-
348
-
349
-
350
-
351
-
352
-
353
-
354
-
355
-
356
-
357
-
358
-
359
-
360
-
361
-
362
-
363
-
364
-
365
-
366
-
367
-
368
-
369
-
370
-
371
-
372
-
373
-
374
-
375
-
376
-
377
-
378
-
379
-
380
-
381
-
382
-
383
-
384
-
385
-
386
-
387
-
 388
388 -
 389
389 -
 390
390 -
 391
391 -
 392
392 -
 393
393 -
 394
394 -
 395
395 -
 396
396 -
 397
397 -
 398
398 -
 399
399 -
 400
400 -
 401
401 -
 402
402 -
 403
403 -
 404
404 -
 405
405 -
 406
406 -
 407
407 -
 408
408 -
409
-
410
-
411
-
412
-
413
-
414
-
415
-
416
-
417
-
418
-
419
-
420
-
421
-
422
-
423
-
424
-
425
-
426
-
427
-
428
-
429
-
430
-
431
-
432
-
433
-
434
-
435
-
436
-
437
-
438
-
439
-
440
-
441
-
442
-
443
-
444
-
445
-
446
-
447
-
448
-
449
-
450
-
451
-
452
-
453
-
454
-
455
-
456
-
457
-
458
-
459
-
460
-
461
-
462
-
463
-
464
-
465
-
466
-
467
-
468
-
469
-
470
-
471
-
472
-
473
-
474
-
475
-
476
-
477
-
478
-
479
-
480
-
481
-
482
-
483
-
484
-
485
-
486
-
487
-
488
-
489
-
490
-
491
-
492
-
493
-
494
-
495
-
496
-
497
-
498
-
499
-
500
-
501
-
502
-
503
-
504
-
505
-
506
-
507
-
508
-
509
-
510
-
511
-
512
-
513
-
514
-
515
-
516
-
517
-
518
-
519
-
520
-
521
-
522
-
523
-
524
-
525
-
526
-
527
-
528
-
529
-
530
-
531
-
532
-
533
-
534
-
535
-
536
-
537
-
538
-
539
-
540
-
541
-
542
-
543
-
544
-
545
-
546
-
547
-
548
-
549
-
550
-
551
-
552
-
553
-
554
-
555
-
556
-
557
-
558
-
559
-
560
-
561
-
562
-
563
-
564
 |
 |

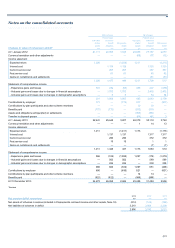
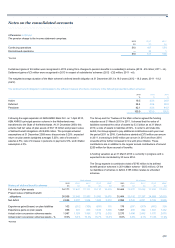
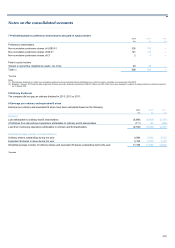
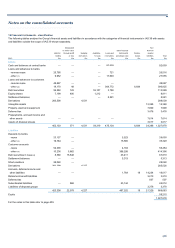
Notes on the consolidated accounts
396
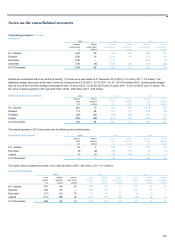
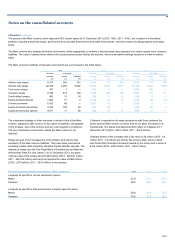
3 Operating expenses continued
Sharesave
2013 2012 2011
Average Shares Average Shares Average Shares
exercise price under option exercise price under option exercise price under option
£ (million) £ (million) £ (million)
A
t 1 January 2.86 57 3.36 64 4.88 101
Granted 2.96 13 2.49 14 2.33 30
Exercised 2.36 —2.37 — 3.80 (1)
Cancelled 3.38 (8) 3.76 (21) 4.11 (66)
A
t 31 Decembe
r
2.90 62 2.86 57 3.36 64
Options are exercisable within six months of vesting; 1.3 million were exercisable at 31 December 2013 (2012 - 0.2 million; 2011 - 0.3 million). The
weighted average share price at the date of exercise of options was £3.36 (2012 - £2.78; 2011 - £4.21). At 31 December 2013, exercise prices ranged
from £2.33 to £39.27 and the average contractual life was 3.5 years (2012 - £2.33 to £39.27 and 3.9 years; 2011 - £2.33 to £39.27 and 3.7 years). The
fair value of options granted in 2013 was £25 million (2012 - £28 million; 2011 - £43 million).
Deferred performance awards 2013 2012 2011
Value at Shares Value at Shares Value at Shares
grant awarded grant awarded grant awarded
£m (million) £m (million) £m (million)
A
t 1 January 261 73 756 191 1,009 267
Granted 113 36 141 50 258 58
Forfeited (48) (14) (98) (25) (47) (13)
Vested (146) (40) (538) (143) (464) (121)
A
t 31 Decembe
r
180 55 261 73 756 191
The awards granted in 2013 vest evenly over the following three anniversaries.
Restricted share awards 2013 2012 2011
Value at Shares Value at Shares Value at Shares
grant awarded grant awarded grant awarded
£m (million) £m (million) £m (million)
A
t 1 January 16 3100 30 110 34
Exercised (9) (2) (49) (17) (6) (3)
Lapsed (7) (1) (35) (10) (4) (1)
A
t 31 Decembe
r
— — 16 3 100 30
The market value of awards exercised in 2013 was £6 million (2012 - £45 million; 2011 - £11 million).
Long-term incentives
2013 2012 2011
Value Shares Options Value Shares Options Value Shares Options
at grant awarded over shares at grant awarded over shares at grant awarded over shares
£m (million) (million) £m (million) (million) £m (million) (million)
A
t 1 January 375 98 20 345 58 37 219 25 38
Granted 109 35 —157 59 —154 37 1
Exercised (51) (11) (3) (15) (4) (1) (6) (1) —
Lapsed (113) (28) (4) (112) (15) (16) (22) (3) (2)
A
t 31 Decembe
r
320 94 13 375 98 20 345 58 37