RBS 2013 Annual Report Download - page 285
Download and view the complete annual report
Please find page 285 of the 2013 RBS annual report below. You can navigate through the pages in the report by either clicking on the pages listed below, or by using the keyword search tool below to find specific information within the annual report.-
 1
1 -
2
-
3
-
4
-
5
-
6
-
7
-
8
-
9
-
10
-
11
-
12
-
13
-
14
-
15
-
16
-
17
-
18
-
19
-
20
-
21
-
22
-
23
-
24
-
25
-
26
-
27
-
28
-
29
-
30
-
31
-
32
-
33
-
34
-
35
-
36
-
37
-
38
-
39
-
40
-
41
-
42
-
43
-
44
-
45
-
46
-
47
-
48
-
49
-
50
-
51
-
52
-
53
-
54
-
55
-
56
-
57
-
58
-
59
-
60
-
61
-
62
-
63
-
64
-
65
-
66
-
67
-
68
-
69
-
70
-
71
-
72
-
73
-
74
-
75
-
76
-
77
-
78
-
79
-
80
-
81
-
82
-
83
-
84
-
85
-
86
-
87
-
88
-
89
-
90
-
91
-
92
-
93
-
94
-
95
-
96
-
97
-
98
-
99
-
100
-
101
-
102
-
103
-
104
-
105
-
106
-
107
-
108
-
109
-
110
-
111
-
112
-
113
-
114
-
115
-
116
-
117
-
118
-
119
-
120
-
121
-
122
-
123
-
124
-
125
-
126
-
127
-
128
-
129
-
130
-
131
-
132
-
133
-
134
-
135
-
136
-
137
-
138
-
139
-
140
-
141
-
142
-
143
-
144
-
145
-
146
-
147
-
148
-
149
-
150
-
151
-
152
-
153
-
154
-
155
-
156
-
157
-
158
-
159
-
160
-
161
-
162
-
163
-
164
-
165
-
166
-
167
-
168
-
169
-
170
-
171
-
172
-
173
-
174
-
175
-
176
-
177
-
178
-
179
-
180
-
181
-
182
-
183
-
184
-
185
-
186
-
187
-
188
-
189
-
190
-
191
-
192
-
193
-
194
-
195
-
196
-
197
-
198
-
199
-
200
-
201
-
202
-
203
-
204
-
205
-
206
-
207
-
208
-
209
-
210
-
211
-
212
-
213
-
214
-
215
-
216
-
217
-
218
-
219
-
220
-
221
-
222
-
223
-
224
-
225
-
226
-
227
-
228
-
229
-
230
-
231
-
232
-
233
-
234
-
235
-
236
-
237
-
238
-
239
-
240
-
241
-
242
-
243
-
244
-
245
-
246
-
247
-
248
-
249
-
250
-
251
-
252
-
253
-
254
-
255
-
256
-
257
-
258
-
259
-
260
-
261
-
262
-
263
-
264
-
265
-
266
-
267
-
268
-
269
-
270
-
271
-
272
-
273
-
274
-
 275
275 -
 276
276 -
 277
277 -
 278
278 -
 279
279 -
 280
280 -
 281
281 -
 282
282 -
 283
283 -
 284
284 -
 285
285 -
 286
286 -
 287
287 -
 288
288 -
 289
289 -
 290
290 -
 291
291 -
 292
292 -
 293
293 -
 294
294 -
 295
295 -
296
-
297
-
298
-
299
-
300
-
301
-
302
-
303
-
304
-
305
-
306
-
307
-
308
-
309
-
310
-
311
-
312
-
313
-
314
-
315
-
316
-
317
-
318
-
319
-
320
-
321
-
322
-
323
-
324
-
325
-
326
-
327
-
328
-
329
-
330
-
331
-
332
-
333
-
334
-
335
-
336
-
337
-
338
-
339
-
340
-
341
-
342
-
343
-
344
-
345
-
346
-
347
-
348
-
349
-
350
-
351
-
352
-
353
-
354
-
355
-
356
-
357
-
358
-
359
-
360
-
361
-
362
-
363
-
364
-
365
-
366
-
367
-
368
-
369
-
370
-
371
-
372
-
373
-
374
-
375
-
376
-
377
-
378
-
379
-
380
-
381
-
382
-
383
-
384
-
385
-
386
-
387
-
388
-
389
-
390
-
391
-
392
-
393
-
394
-
395
-
396
-
397
-
398
-
399
-
400
-
401
-
402
-
403
-
404
-
405
-
406
-
407
-
408
-
409
-
410
-
411
-
412
-
413
-
414
-
415
-
416
-
417
-
418
-
419
-
420
-
421
-
422
-
423
-
424
-
425
-
426
-
427
-
428
-
429
-
430
-
431
-
432
-
433
-
434
-
435
-
436
-
437
-
438
-
439
-
440
-
441
-
442
-
443
-
444
-
445
-
446
-
447
-
448
-
449
-
450
-
451
-
452
-
453
-
454
-
455
-
456
-
457
-
458
-
459
-
460
-
461
-
462
-
463
-
464
-
465
-
466
-
467
-
468
-
469
-
470
-
471
-
472
-
473
-
474
-
475
-
476
-
477
-
478
-
479
-
480
-
481
-
482
-
483
-
484
-
485
-
486
-
487
-
488
-
489
-
490
-
491
-
492
-
493
-
494
-
495
-
496
-
497
-
498
-
499
-
500
-
501
-
502
-
503
-
504
-
505
-
506
-
507
-
508
-
509
-
510
-
511
-
512
-
513
-
514
-
515
-
516
-
517
-
518
-
519
-
520
-
521
-
522
-
523
-
524
-
525
-
526
-
527
-
528
-
529
-
530
-
531
-
532
-
533
-
534
-
535
-
536
-
537
-
538
-
539
-
540
-
541
-
542
-
543
-
544
-
545
-
546
-
547
-
548
-
549
-
550
-
551
-
552
-
553
-
554
-
555
-
556
-
557
-
558
-
559
-
560
-
561
-
562
-
563
-
564
 |
 |

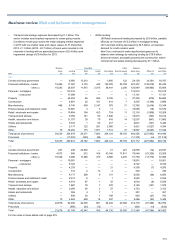
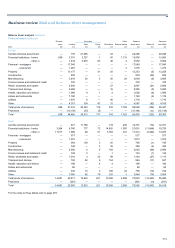
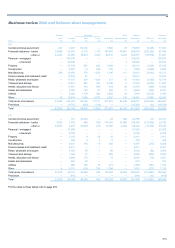
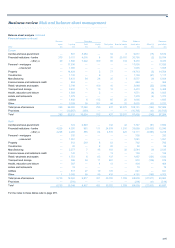
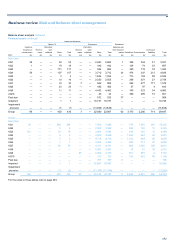
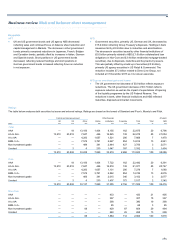
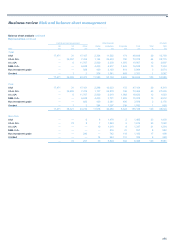
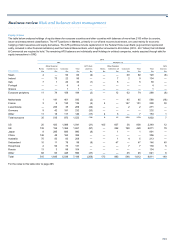
Business review Risk and balance sheet management
283
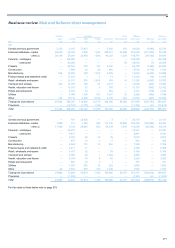
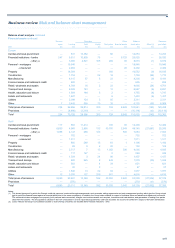
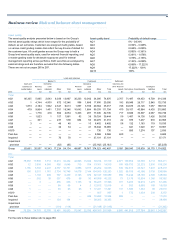
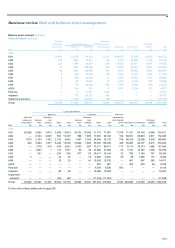
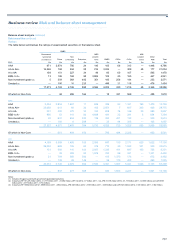
Cash and Settlement
balances at Loans and advances balances and other Contingent
central banks Banks (1) Customers financial assets Derivatives Commitments liabilities Total
2011 (2) £m £m £m £m £m £m £m £m
Non-Core
A
Q1 58 590 18,733 118 3,876 6,136 827 30,338
A
Q2 — 4 1,652 2677 865 32 3,232
A
Q3 167 14 3,471 —467 1,152 73 5,344
A
Q4 1 55 6,616 1946 1,263 192 9,074
A
Q5 — 5 7,145 —1,429 1,367 209 10,155
A
Q6 — 48 6,416 —234 1,035 28 7,761
A
Q7 — — 4,265 —1,597 1,649 88 7,599
A
Q8 — 10 2,014 —586 91 40 2,741
A
Q9 — — 4,491 48 558 517 45 5,659
A
Q10 — — 306 —708 1,080 41 2,135
Past due — — 1,544 — — — — 1,544
Impaired — 1 23,464 1 — — — 23,466
Impairment provision — (1) (11,486) (1) — — — (11,488)
Group 226 726 68,631 169 11,078 15,155 1,575 97,560
Notes:
(1) Excludes items in the course of collection from other banks of £1,454 million (2012 - £1,531 million; 2011 - £1,470 million).
(2) Excludes balances in relation to Direct Line Group (loans to banks: 2012 - £2,036 million; 2011 - £2,579 million and loans to customers: 2012 - £881 million; 2011 - £893 million).
(3) Exposures are allocated to asset quality bands on the basis of statistically driven models which produce an estimate of default rate. The variables included in the models vary by product and
geography. For portfolios secured on residential property these models typically include measures of delinquency and loan-to-value as well as other differentiating characteristics such as bureau
score, product features or associated account performance information.
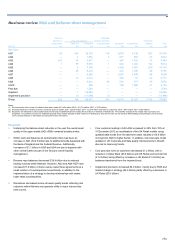
Key points
• Underlying the balance sheet reduction in the year the overall asset
quality in the upper bands (AQ1-AQ5) remained broadly similar.
• Within cash and balances at central banks there has been an
increase in AQ1 of £2.3 billion due to additional funds deposited with
the Bank of England and the Federal Reserve. Additionally,
increases of £1.1 billion in AQ3 and AQ4 are due to deposits with
other central banks as part of the Group’s overall liquidity
management.
• Reverse repo balances decreased £28.4 billion due to reduced
trading volumes within Markets. However, AQ2 and AQ4-AQ7 have
increased £7.2 billion in bank reverse repurchase agreements as a
small number of counterparties moved bands, in addition to the
implementation of a strategy to develop relationships with newer,
lower-rated counterparties.
• Derivatives decreased across all asset quality bands reflecting risk
reduction within Markets and upwards shifts in major interest rate
yield curves.
• Core customer lending in AQ1-AQ3 increased to 22% from 18% at
31 December 2012 as recalibration of the UK Retail models using
updated data trends from the last three years resulted in £9.8 billion
moving from AQ5 to higher bands. In addition, mid corporate model
updates in UK Corporate and data quality improvements in Wealth
also led to improving trends.
• Core past due loans to customers decreased £1.2 billion, with a
reduction in Ulster Bank (£0.8 billion) and US Retail and Commercial
(£1.2 billion) being offset by increases in UK Retail (£1.2 billion) as
balances transferred from the impaired book.
• Impairment provisions increased £4.0 billion, mainly due to RCR and
related change in strategy (£4.5 billion) partly offset by a decrease in
UK Retail (£0.5 billion).