RBS 2013 Annual Report Download - page 131
Download and view the complete annual report
Please find page 131 of the 2013 RBS annual report below. You can navigate through the pages in the report by either clicking on the pages listed below, or by using the keyword search tool below to find specific information within the annual report.-
 1
1 -
2
-
3
-
4
-
5
-
6
-
7
-
8
-
9
-
10
-
11
-
12
-
13
-
14
-
15
-
16
-
17
-
18
-
19
-
20
-
21
-
22
-
23
-
24
-
25
-
26
-
27
-
28
-
29
-
30
-
31
-
32
-
33
-
34
-
35
-
36
-
37
-
38
-
39
-
40
-
41
-
42
-
43
-
44
-
45
-
46
-
47
-
48
-
49
-
50
-
51
-
52
-
53
-
54
-
55
-
56
-
57
-
58
-
59
-
60
-
61
-
62
-
63
-
64
-
65
-
66
-
67
-
68
-
69
-
70
-
71
-
72
-
73
-
74
-
75
-
76
-
77
-
78
-
79
-
80
-
81
-
82
-
83
-
84
-
85
-
86
-
87
-
88
-
89
-
90
-
91
-
92
-
93
-
94
-
95
-
96
-
97
-
98
-
99
-
100
-
101
-
102
-
103
-
104
-
105
-
106
-
107
-
108
-
109
-
110
-
111
-
112
-
113
-
114
-
115
-
116
-
117
-
118
-
119
-
120
-
 121
121 -
 122
122 -
 123
123 -
 124
124 -
 125
125 -
 126
126 -
 127
127 -
 128
128 -
 129
129 -
 130
130 -
 131
131 -
 132
132 -
 133
133 -
 134
134 -
 135
135 -
 136
136 -
 137
137 -
 138
138 -
 139
139 -
 140
140 -
 141
141 -
142
-
143
-
144
-
145
-
146
-
147
-
148
-
149
-
150
-
151
-
152
-
153
-
154
-
155
-
156
-
157
-
158
-
159
-
160
-
161
-
162
-
163
-
164
-
165
-
166
-
167
-
168
-
169
-
170
-
171
-
172
-
173
-
174
-
175
-
176
-
177
-
178
-
179
-
180
-
181
-
182
-
183
-
184
-
185
-
186
-
187
-
188
-
189
-
190
-
191
-
192
-
193
-
194
-
195
-
196
-
197
-
198
-
199
-
200
-
201
-
202
-
203
-
204
-
205
-
206
-
207
-
208
-
209
-
210
-
211
-
212
-
213
-
214
-
215
-
216
-
217
-
218
-
219
-
220
-
221
-
222
-
223
-
224
-
225
-
226
-
227
-
228
-
229
-
230
-
231
-
232
-
233
-
234
-
235
-
236
-
237
-
238
-
239
-
240
-
241
-
242
-
243
-
244
-
245
-
246
-
247
-
248
-
249
-
250
-
251
-
252
-
253
-
254
-
255
-
256
-
257
-
258
-
259
-
260
-
261
-
262
-
263
-
264
-
265
-
266
-
267
-
268
-
269
-
270
-
271
-
272
-
273
-
274
-
275
-
276
-
277
-
278
-
279
-
280
-
281
-
282
-
283
-
284
-
285
-
286
-
287
-
288
-
289
-
290
-
291
-
292
-
293
-
294
-
295
-
296
-
297
-
298
-
299
-
300
-
301
-
302
-
303
-
304
-
305
-
306
-
307
-
308
-
309
-
310
-
311
-
312
-
313
-
314
-
315
-
316
-
317
-
318
-
319
-
320
-
321
-
322
-
323
-
324
-
325
-
326
-
327
-
328
-
329
-
330
-
331
-
332
-
333
-
334
-
335
-
336
-
337
-
338
-
339
-
340
-
341
-
342
-
343
-
344
-
345
-
346
-
347
-
348
-
349
-
350
-
351
-
352
-
353
-
354
-
355
-
356
-
357
-
358
-
359
-
360
-
361
-
362
-
363
-
364
-
365
-
366
-
367
-
368
-
369
-
370
-
371
-
372
-
373
-
374
-
375
-
376
-
377
-
378
-
379
-
380
-
381
-
382
-
383
-
384
-
385
-
386
-
387
-
388
-
389
-
390
-
391
-
392
-
393
-
394
-
395
-
396
-
397
-
398
-
399
-
400
-
401
-
402
-
403
-
404
-
405
-
406
-
407
-
408
-
409
-
410
-
411
-
412
-
413
-
414
-
415
-
416
-
417
-
418
-
419
-
420
-
421
-
422
-
423
-
424
-
425
-
426
-
427
-
428
-
429
-
430
-
431
-
432
-
433
-
434
-
435
-
436
-
437
-
438
-
439
-
440
-
441
-
442
-
443
-
444
-
445
-
446
-
447
-
448
-
449
-
450
-
451
-
452
-
453
-
454
-
455
-
456
-
457
-
458
-
459
-
460
-
461
-
462
-
463
-
464
-
465
-
466
-
467
-
468
-
469
-
470
-
471
-
472
-
473
-
474
-
475
-
476
-
477
-
478
-
479
-
480
-
481
-
482
-
483
-
484
-
485
-
486
-
487
-
488
-
489
-
490
-
491
-
492
-
493
-
494
-
495
-
496
-
497
-
498
-
499
-
500
-
501
-
502
-
503
-
504
-
505
-
506
-
507
-
508
-
509
-
510
-
511
-
512
-
513
-
514
-
515
-
516
-
517
-
518
-
519
-
520
-
521
-
522
-
523
-
524
-
525
-
526
-
527
-
528
-
529
-
530
-
531
-
532
-
533
-
534
-
535
-
536
-
537
-
538
-
539
-
540
-
541
-
542
-
543
-
544
-
545
-
546
-
547
-
548
-
549
-
550
-
551
-
552
-
553
-
554
-
555
-
556
-
557
-
558
-
559
-
560
-
561
-
562
-
563
-
564
 |
 |

Business review
129
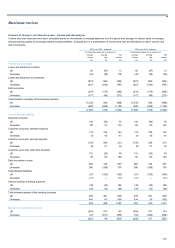
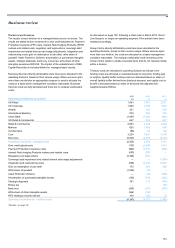
Divisional performance
The results of each division on a managed basis are set out below. The
results are stated before movements in own credit adjustments, Payment
Protection Insurance (PPI) costs, Interest Rate Hedging Products (IRHP)
redress and related costs, regulatory and legal actions, sovereign debt
impairment and related interest rate hedge adjustments, integration and
restructuring costs, gain on redemption of own debt, write-down of
goodwill, Asset Protection Scheme, amortisation of purchased intangible
assets, strategic disposals, bank levy, bonus tax, write-down of other
intangible assets and RFS MI. The impact of the establishment of RBS
Capital Resolution is included within the ‘managed basis’ results.
Business Services directly attributable costs have been allocated to the
operating divisions, based on their service usage. Where services span
more than one division an appropriate measure is used to allocate the
costs on a basis which management considers reasonable. Business
Services costs are fully allocated and there are no residual unallocated
costs.
As discussed on page 102, following a share sale in March 2013, Direct
Line Group is no longer an operating segment. Prior periods have been
restated accordingly.
Group Centre directly attributable costs have been allocated to the
operating divisions, based on their service usage. Where services span
more than one division, the costs are allocated on a basis management
considers reasonable. The residual unallocated costs remaining in the
Group Centre relate to volatile corporate items that do not naturally reside
within a division.
Treasury costs are allocated to operating divisions as follows: term
funding costs are allocated or rewarded based on long term funding gap
or surplus; liquidity buffer funding costs are allocated based on share of
overall liquidity buffer derived from divisional stresses; and capital cost or
benefit is allocated based on share of divisional risk-adjusted risk-
weighted assets (RWAs).
2013 2012* 2011*
Operating profit/(loss) by division £m £m £m
UK Retail 1,943 1,891 2,021
UK Corporate 1,060 1,796 1,924
Wealth 221 243 242
International Banking 279 594 755
Ulster Bank (1,457) (1,040) (984)
US Retail & Commercial 647 754 537
Retail & Commercial 2,693 4,238 4,495
Markets 620 1,509 899
Central items (89) 84 (34)
Core 3,224 5,831 5,360
Non-Core (5,527) (2,879) (4,219)
Operating (loss)/profit - managed basis (2,303) 2,952 1,141
Own credit adjustments (120) (4,649) 1,914
Payment Protection Insurance costs (900) (1,110) (850)
Interest Rate Hedging Products redress and related costs (550) (700) —
Regulatory and legal actions (2,394) (381) —
Sovereign debt impairment and related interest rate hedge adjustments — — (1,268)
Integration and restructuring costs (656) (1,415) (1,021)
Gain on redemption of own debt 175 454 255
Write-down of goodwill (1,059) (18) —
A
sset Protection Scheme — (44) (906)
A
mortisation of purchased intangible assets (153) (178) (222)
Strategic disposals 161 113 (105)
Bonus tax — — (27)
Bank levy (200) (175) (300)
Write-down of other intangible assets (344) (106) —
RFS Holdings minority interest 100 (20) (7)
Operating loss before tax - statutory basis (8,243) (5,277) (1,396)
*Restated - see page 102.