RBS 2013 Annual Report Download - page 118
Download and view the complete annual report
Please find page 118 of the 2013 RBS annual report below. You can navigate through the pages in the report by either clicking on the pages listed below, or by using the keyword search tool below to find specific information within the annual report.-
 1
1 -
2
-
3
-
4
-
5
-
6
-
7
-
8
-
9
-
10
-
11
-
12
-
13
-
14
-
15
-
16
-
17
-
18
-
19
-
20
-
21
-
22
-
23
-
24
-
25
-
26
-
27
-
28
-
29
-
30
-
31
-
32
-
33
-
34
-
35
-
36
-
37
-
38
-
39
-
40
-
41
-
42
-
43
-
44
-
45
-
46
-
47
-
48
-
49
-
50
-
51
-
52
-
53
-
54
-
55
-
56
-
57
-
58
-
59
-
60
-
61
-
62
-
63
-
64
-
65
-
66
-
67
-
68
-
69
-
70
-
71
-
72
-
73
-
74
-
75
-
76
-
77
-
78
-
79
-
80
-
81
-
82
-
83
-
84
-
85
-
86
-
87
-
88
-
89
-
90
-
91
-
92
-
93
-
94
-
95
-
96
-
97
-
98
-
99
-
100
-
101
-
102
-
103
-
104
-
105
-
106
-
107
-
 108
108 -
 109
109 -
 110
110 -
 111
111 -
 112
112 -
 113
113 -
 114
114 -
 115
115 -
 116
116 -
 117
117 -
 118
118 -
 119
119 -
 120
120 -
 121
121 -
 122
122 -
 123
123 -
 124
124 -
 125
125 -
 126
126 -
 127
127 -
 128
128 -
129
-
130
-
131
-
132
-
133
-
134
-
135
-
136
-
137
-
138
-
139
-
140
-
141
-
142
-
143
-
144
-
145
-
146
-
147
-
148
-
149
-
150
-
151
-
152
-
153
-
154
-
155
-
156
-
157
-
158
-
159
-
160
-
161
-
162
-
163
-
164
-
165
-
166
-
167
-
168
-
169
-
170
-
171
-
172
-
173
-
174
-
175
-
176
-
177
-
178
-
179
-
180
-
181
-
182
-
183
-
184
-
185
-
186
-
187
-
188
-
189
-
190
-
191
-
192
-
193
-
194
-
195
-
196
-
197
-
198
-
199
-
200
-
201
-
202
-
203
-
204
-
205
-
206
-
207
-
208
-
209
-
210
-
211
-
212
-
213
-
214
-
215
-
216
-
217
-
218
-
219
-
220
-
221
-
222
-
223
-
224
-
225
-
226
-
227
-
228
-
229
-
230
-
231
-
232
-
233
-
234
-
235
-
236
-
237
-
238
-
239
-
240
-
241
-
242
-
243
-
244
-
245
-
246
-
247
-
248
-
249
-
250
-
251
-
252
-
253
-
254
-
255
-
256
-
257
-
258
-
259
-
260
-
261
-
262
-
263
-
264
-
265
-
266
-
267
-
268
-
269
-
270
-
271
-
272
-
273
-
274
-
275
-
276
-
277
-
278
-
279
-
280
-
281
-
282
-
283
-
284
-
285
-
286
-
287
-
288
-
289
-
290
-
291
-
292
-
293
-
294
-
295
-
296
-
297
-
298
-
299
-
300
-
301
-
302
-
303
-
304
-
305
-
306
-
307
-
308
-
309
-
310
-
311
-
312
-
313
-
314
-
315
-
316
-
317
-
318
-
319
-
320
-
321
-
322
-
323
-
324
-
325
-
326
-
327
-
328
-
329
-
330
-
331
-
332
-
333
-
334
-
335
-
336
-
337
-
338
-
339
-
340
-
341
-
342
-
343
-
344
-
345
-
346
-
347
-
348
-
349
-
350
-
351
-
352
-
353
-
354
-
355
-
356
-
357
-
358
-
359
-
360
-
361
-
362
-
363
-
364
-
365
-
366
-
367
-
368
-
369
-
370
-
371
-
372
-
373
-
374
-
375
-
376
-
377
-
378
-
379
-
380
-
381
-
382
-
383
-
384
-
385
-
386
-
387
-
388
-
389
-
390
-
391
-
392
-
393
-
394
-
395
-
396
-
397
-
398
-
399
-
400
-
401
-
402
-
403
-
404
-
405
-
406
-
407
-
408
-
409
-
410
-
411
-
412
-
413
-
414
-
415
-
416
-
417
-
418
-
419
-
420
-
421
-
422
-
423
-
424
-
425
-
426
-
427
-
428
-
429
-
430
-
431
-
432
-
433
-
434
-
435
-
436
-
437
-
438
-
439
-
440
-
441
-
442
-
443
-
444
-
445
-
446
-
447
-
448
-
449
-
450
-
451
-
452
-
453
-
454
-
455
-
456
-
457
-
458
-
459
-
460
-
461
-
462
-
463
-
464
-
465
-
466
-
467
-
468
-
469
-
470
-
471
-
472
-
473
-
474
-
475
-
476
-
477
-
478
-
479
-
480
-
481
-
482
-
483
-
484
-
485
-
486
-
487
-
488
-
489
-
490
-
491
-
492
-
493
-
494
-
495
-
496
-
497
-
498
-
499
-
500
-
501
-
502
-
503
-
504
-
505
-
506
-
507
-
508
-
509
-
510
-
511
-
512
-
513
-
514
-
515
-
516
-
517
-
518
-
519
-
520
-
521
-
522
-
523
-
524
-
525
-
526
-
527
-
528
-
529
-
530
-
531
-
532
-
533
-
534
-
535
-
536
-
537
-
538
-
539
-
540
-
541
-
542
-
543
-
544
-
545
-
546
-
547
-
548
-
549
-
550
-
551
-
552
-
553
-
554
-
555
-
556
-
557
-
558
-
559
-
560
-
561
-
562
-
563
-
564
 |
 |

Business review
116
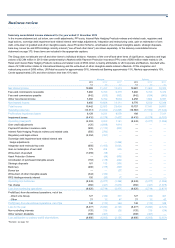
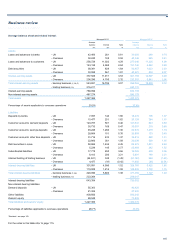
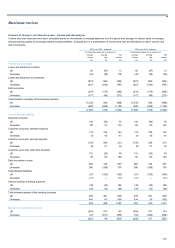
Average balance sheet and related interest
Managed 2013 Managed 2012*
Average Average
balance Interest Rate balance Interest Rate
£m £m %£m £m %
A
ssets
Loans and advances to banks - UK 42,466 261 0.61 33,656 248 0.74
- Overseas 32,240 169 0.52 40,342 245 0.61
Loans and advances to customers - UK 256,728 11,022 4.29 277,646 11,326 4.08
- Overseas 143,128 4,065 2.84 151,740 4,862 3.20
Debt securities - UK 38,391 628 1.64 50,457 1,023 2.03
- Overseas 30,928 561 1.81 40,221 834 2.07
Interest-earning assets - UK 337,585 11,911 3.53 361,759 12,597 3.48
- Overseas 206,296 4,795 2.32 232,303 5,941 2.56
Total interest-earning assets - banking business (1,3,4,5) 543,881 16,706 3.07 594,062 18,538 3.12
- trading business (10) 216,211 240,131
Interest-earning assets 760,092 834,193
Non-interest-earning assets 467,274 596,179
Total assets 1,227,366 1,430,372
Percentage of assets applicable to overseas operations 33.0% 37.8%
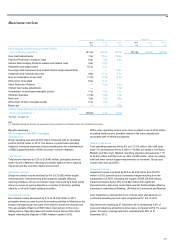
Liabilities
Deposits by banks - UK 7,997 144 1.80 18,276 196 1.07
- Overseas 15,477 251 1.62 20,129 384 1.91
Customer accounts: demand deposits - UK 123,707 501 0.40 121,541 643 0.53
- Overseas 35,733 169 0.47 35,087 210 0.60
Customer accounts: savings deposits - UK 93,245 1,266 1.36 84,972 1,479 1.74
- Overseas 28,864 101 0.35 26,989 133 0.49
Customer accounts: other time deposits - UK 31,714 433 1.37 39,813 522 1.31
- Overseas 22,806 361 1.58 26,038 509 1.95
Debt securities in issue - UK 50,684 1,244 2.45 69,272 1,831 2.64
- Overseas 5,239 145 2.77 22,469 342 1.52
Subordinated liabilities - UK 17,775 650 3.66 16,026 490 3.06
- Overseas 6,413 206 3.21 5,891 189 3.21
Internal funding of trading business - UK (24,041) 348 (1.45) (21,140) 264 (1.25)
- Overseas 4,477 (19) (0.42) 11,992 (65) (0.54)
Interest-bearing liabilities - UK 301,081 4,586 1.52 328,760 5,425 1.65
- Overseas 119,009 1,214 1.02 148,595 1,702 1.15
Total interest-bearing liabilities - banking business (1,3,4) 420,090 5,800 1.38 477,355 7,127 1.49
- trading business (10) 223,264 248,647
Interest-bearing liabilities 643,354 726,002
Non-interest-bearing liabilities:
Demand deposits - UK 55,303 46,420
- Overseas 21,304 27,900
Other liabilities 438,856 556,242
Owners' equity 68,549 73,808
Total liabilities and owners' equity 1,227,366 1,430,372
Percentage of liabilities applicable to overseas operations 28.7% 33.9%
*Restated - see page 102.
For the notes to this table refer to page 115.