RBS 2013 Annual Report Download - page 246
Download and view the complete annual report
Please find page 246 of the 2013 RBS annual report below. You can navigate through the pages in the report by either clicking on the pages listed below, or by using the keyword search tool below to find specific information within the annual report.-
 1
1 -
2
-
3
-
4
-
5
-
6
-
7
-
8
-
9
-
10
-
11
-
12
-
13
-
14
-
15
-
16
-
17
-
18
-
19
-
20
-
21
-
22
-
23
-
24
-
25
-
26
-
27
-
28
-
29
-
30
-
31
-
32
-
33
-
34
-
35
-
36
-
37
-
38
-
39
-
40
-
41
-
42
-
43
-
44
-
45
-
46
-
47
-
48
-
49
-
50
-
51
-
52
-
53
-
54
-
55
-
56
-
57
-
58
-
59
-
60
-
61
-
62
-
63
-
64
-
65
-
66
-
67
-
68
-
69
-
70
-
71
-
72
-
73
-
74
-
75
-
76
-
77
-
78
-
79
-
80
-
81
-
82
-
83
-
84
-
85
-
86
-
87
-
88
-
89
-
90
-
91
-
92
-
93
-
94
-
95
-
96
-
97
-
98
-
99
-
100
-
101
-
102
-
103
-
104
-
105
-
106
-
107
-
108
-
109
-
110
-
111
-
112
-
113
-
114
-
115
-
116
-
117
-
118
-
119
-
120
-
121
-
122
-
123
-
124
-
125
-
126
-
127
-
128
-
129
-
130
-
131
-
132
-
133
-
134
-
135
-
136
-
137
-
138
-
139
-
140
-
141
-
142
-
143
-
144
-
145
-
146
-
147
-
148
-
149
-
150
-
151
-
152
-
153
-
154
-
155
-
156
-
157
-
158
-
159
-
160
-
161
-
162
-
163
-
164
-
165
-
166
-
167
-
168
-
169
-
170
-
171
-
172
-
173
-
174
-
175
-
176
-
177
-
178
-
179
-
180
-
181
-
182
-
183
-
184
-
185
-
186
-
187
-
188
-
189
-
190
-
191
-
192
-
193
-
194
-
195
-
196
-
197
-
198
-
199
-
200
-
201
-
202
-
203
-
204
-
205
-
206
-
207
-
208
-
209
-
210
-
211
-
212
-
213
-
214
-
215
-
216
-
217
-
218
-
219
-
220
-
221
-
222
-
223
-
224
-
225
-
226
-
227
-
228
-
229
-
230
-
231
-
232
-
233
-
234
-
235
-
 236
236 -
 237
237 -
 238
238 -
 239
239 -
 240
240 -
 241
241 -
 242
242 -
 243
243 -
 244
244 -
 245
245 -
 246
246 -
 247
247 -
 248
248 -
 249
249 -
 250
250 -
 251
251 -
 252
252 -
 253
253 -
 254
254 -
 255
255 -
 256
256 -
257
-
258
-
259
-
260
-
261
-
262
-
263
-
264
-
265
-
266
-
267
-
268
-
269
-
270
-
271
-
272
-
273
-
274
-
275
-
276
-
277
-
278
-
279
-
280
-
281
-
282
-
283
-
284
-
285
-
286
-
287
-
288
-
289
-
290
-
291
-
292
-
293
-
294
-
295
-
296
-
297
-
298
-
299
-
300
-
301
-
302
-
303
-
304
-
305
-
306
-
307
-
308
-
309
-
310
-
311
-
312
-
313
-
314
-
315
-
316
-
317
-
318
-
319
-
320
-
321
-
322
-
323
-
324
-
325
-
326
-
327
-
328
-
329
-
330
-
331
-
332
-
333
-
334
-
335
-
336
-
337
-
338
-
339
-
340
-
341
-
342
-
343
-
344
-
345
-
346
-
347
-
348
-
349
-
350
-
351
-
352
-
353
-
354
-
355
-
356
-
357
-
358
-
359
-
360
-
361
-
362
-
363
-
364
-
365
-
366
-
367
-
368
-
369
-
370
-
371
-
372
-
373
-
374
-
375
-
376
-
377
-
378
-
379
-
380
-
381
-
382
-
383
-
384
-
385
-
386
-
387
-
388
-
389
-
390
-
391
-
392
-
393
-
394
-
395
-
396
-
397
-
398
-
399
-
400
-
401
-
402
-
403
-
404
-
405
-
406
-
407
-
408
-
409
-
410
-
411
-
412
-
413
-
414
-
415
-
416
-
417
-
418
-
419
-
420
-
421
-
422
-
423
-
424
-
425
-
426
-
427
-
428
-
429
-
430
-
431
-
432
-
433
-
434
-
435
-
436
-
437
-
438
-
439
-
440
-
441
-
442
-
443
-
444
-
445
-
446
-
447
-
448
-
449
-
450
-
451
-
452
-
453
-
454
-
455
-
456
-
457
-
458
-
459
-
460
-
461
-
462
-
463
-
464
-
465
-
466
-
467
-
468
-
469
-
470
-
471
-
472
-
473
-
474
-
475
-
476
-
477
-
478
-
479
-
480
-
481
-
482
-
483
-
484
-
485
-
486
-
487
-
488
-
489
-
490
-
491
-
492
-
493
-
494
-
495
-
496
-
497
-
498
-
499
-
500
-
501
-
502
-
503
-
504
-
505
-
506
-
507
-
508
-
509
-
510
-
511
-
512
-
513
-
514
-
515
-
516
-
517
-
518
-
519
-
520
-
521
-
522
-
523
-
524
-
525
-
526
-
527
-
528
-
529
-
530
-
531
-
532
-
533
-
534
-
535
-
536
-
537
-
538
-
539
-
540
-
541
-
542
-
543
-
544
-
545
-
546
-
547
-
548
-
549
-
550
-
551
-
552
-
553
-
554
-
555
-
556
-
557
-
558
-
559
-
560
-
561
-
562
-
563
-
564
 |
 |

Business review Risk and balance sheet management
244
Credit risk continued
Early problem identification and problem debt management continued
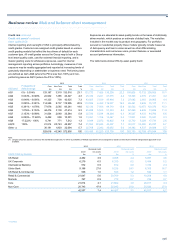
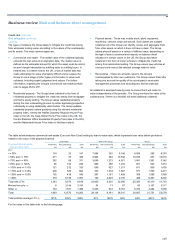
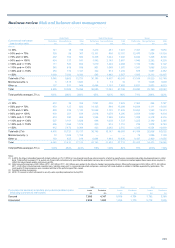
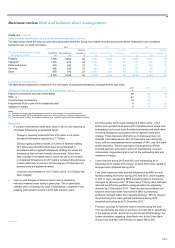
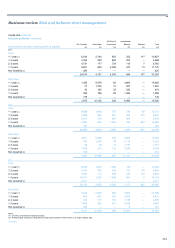
The table below shows the value of loans (excluding loans where the Group has initiated recovery procedures) where forbearance was completed
during the year, by sector and types.
2013 2012 2011
Provision Provision Provision
Performing Non-performing coverage (1) Performing Non-performing Coverage (1) Performing Non-performing Coverage (1)
Wholesale forbearance during
the year by sector £m £m % £m £m % £m £m %
Property 1,759 4,802 60 3,365 3,899 16 2,166 3,215 25
Transport 1,016 229 34 1,174 130 23 771 670 10
Retail and leisure 455 390 37 732 113 34 331 433 10
Services 405 234 77 324 51 30 177 94 3
Other 670 510 27 1,575 550 40 773 731 47
4,305 6,165 55 7,170 4,743 20 4,218 5,143 25
Forbearance arrangements
The table below analyses the incidence of the main types of wholesale forbearance arrangements by loan value.
2013 2012 2011
Wholesale forbearance during the year by arrangement type (2) % % %
Payment concessions and loan rescheduling 78 49 92
Other (3) 31 14 9
Covenant-only concessions 16 30 —
Forgiveness of all or part of the outstanding debt 9 21 33
Variation in margin 2 6 12
Notes:
(1) Provision coverage reflects impairment provision as a percentage of non-performing loans.
(2) The total exceeds 100% as an individual case can involve more than one type of arrangement.
(3) The main types of ‘other’ concessions include formal ‘standstill’ agreements and release of security.
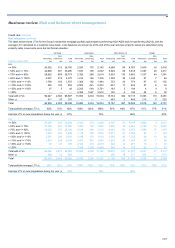
Key points
• A number of refinements have been made in 2013 to the reporting of
wholesale forbearance as explained below:
° Change in reporting thresholds from £10 million to £3 million,
increased forbearance reported by £1.7 billion.
° During ongoing portfolio reviews, a number of facilities totalling
£2.3 billion were identified which were being managed in
accordance with an agreed forbearance strategy but where the
forbearance had not been formally documented. These have
been included in the tables above, which has led to an increase
in completed forbearance for 2013 and a corresponding decrease
in loans which are “in process” for the purpose of forbearance (in
process loans are explained below).
° Covenant only forbearance of £1.7 billion (2012 - £3.5 billion) has
been included.
• Year-on-year analysis of forborne loans may be skewed by
individual material cases during a given year. This is particularly
relevant when comparing the value of forbearance completed in the
property and transport sectors in 2013 with previous years.
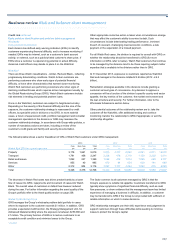
*unaudited
• At 31 December 2013, loans totalling £9.4 billion (2012 - £13.7
billion) were granted credit approval for forbearance but where such
forbearance had not yet been formally documented and which were
not being managed in accordance with an agreed forbearance
strategy. These loans are referred to as in process and are not
included in the tables above. 84% of these were non-performing
loans, with an associated provision coverage of 44%, and 16% were
performing loans. The principal types of arrangements offered
included payment concessions and loan rescheduling, covenant
concessions, forgiveness of all or part of the outstanding debt and
variations in margin.
• Loans forborne during 2012 and 2013 and outstanding at 31
December 2013 totalled £18.4 billion, of which £8.0 billion related to
arrangements completed during 2012.
• Core bank customers were granted forbearance by GRG on loan
facilities totalling £6.9 billion during 2012 and 2013, which equates
to 23% of loans managed by GRG (excluding loans to customers
managed by recovery units). Of these loans, 15% by value had been
returned to performing portfolios managed within the originating
divisions by 31 December 2013. There are also loans that are not
forborne which have been returned from GRG to performing
portfolios managed within the originating divisions. 79% by value of
the performing Core loans granted forbearance during 2012
remained performing as at 31 December 2013.*
• Provision coverage for forborne loans increased during the year.
This was primarily the result of provisions in Ulster Bank, specifically
in the property sector, and driven by the Group’s RCR strategy. For
further information regarding Ulster Bank refer to the Ulster Bank
Group (Core and Non-Core) section on pages 265 to 267.