RBS 2013 Annual Report Download - page 333
Download and view the complete annual report
Please find page 333 of the 2013 RBS annual report below. You can navigate through the pages in the report by either clicking on the pages listed below, or by using the keyword search tool below to find specific information within the annual report.-
 1
1 -
2
-
3
-
4
-
5
-
6
-
7
-
8
-
9
-
10
-
11
-
12
-
13
-
14
-
15
-
16
-
17
-
18
-
19
-
20
-
21
-
22
-
23
-
24
-
25
-
26
-
27
-
28
-
29
-
30
-
31
-
32
-
33
-
34
-
35
-
36
-
37
-
38
-
39
-
40
-
41
-
42
-
43
-
44
-
45
-
46
-
47
-
48
-
49
-
50
-
51
-
52
-
53
-
54
-
55
-
56
-
57
-
58
-
59
-
60
-
61
-
62
-
63
-
64
-
65
-
66
-
67
-
68
-
69
-
70
-
71
-
72
-
73
-
74
-
75
-
76
-
77
-
78
-
79
-
80
-
81
-
82
-
83
-
84
-
85
-
86
-
87
-
88
-
89
-
90
-
91
-
92
-
93
-
94
-
95
-
96
-
97
-
98
-
99
-
100
-
101
-
102
-
103
-
104
-
105
-
106
-
107
-
108
-
109
-
110
-
111
-
112
-
113
-
114
-
115
-
116
-
117
-
118
-
119
-
120
-
121
-
122
-
123
-
124
-
125
-
126
-
127
-
128
-
129
-
130
-
131
-
132
-
133
-
134
-
135
-
136
-
137
-
138
-
139
-
140
-
141
-
142
-
143
-
144
-
145
-
146
-
147
-
148
-
149
-
150
-
151
-
152
-
153
-
154
-
155
-
156
-
157
-
158
-
159
-
160
-
161
-
162
-
163
-
164
-
165
-
166
-
167
-
168
-
169
-
170
-
171
-
172
-
173
-
174
-
175
-
176
-
177
-
178
-
179
-
180
-
181
-
182
-
183
-
184
-
185
-
186
-
187
-
188
-
189
-
190
-
191
-
192
-
193
-
194
-
195
-
196
-
197
-
198
-
199
-
200
-
201
-
202
-
203
-
204
-
205
-
206
-
207
-
208
-
209
-
210
-
211
-
212
-
213
-
214
-
215
-
216
-
217
-
218
-
219
-
220
-
221
-
222
-
223
-
224
-
225
-
226
-
227
-
228
-
229
-
230
-
231
-
232
-
233
-
234
-
235
-
236
-
237
-
238
-
239
-
240
-
241
-
242
-
243
-
244
-
245
-
246
-
247
-
248
-
249
-
250
-
251
-
252
-
253
-
254
-
255
-
256
-
257
-
258
-
259
-
260
-
261
-
262
-
263
-
264
-
265
-
266
-
267
-
268
-
269
-
270
-
271
-
272
-
273
-
274
-
275
-
276
-
277
-
278
-
279
-
280
-
281
-
282
-
283
-
284
-
285
-
286
-
287
-
288
-
289
-
290
-
291
-
292
-
293
-
294
-
295
-
296
-
297
-
298
-
299
-
300
-
301
-
302
-
303
-
304
-
305
-
306
-
307
-
308
-
309
-
310
-
311
-
312
-
313
-
314
-
315
-
316
-
317
-
318
-
319
-
320
-
321
-
322
-
 323
323 -
 324
324 -
 325
325 -
 326
326 -
 327
327 -
 328
328 -
 329
329 -
 330
330 -
 331
331 -
 332
332 -
 333
333 -
 334
334 -
 335
335 -
 336
336 -
 337
337 -
 338
338 -
 339
339 -
 340
340 -
 341
341 -
 342
342 -
 343
343 -
344
-
345
-
346
-
347
-
348
-
349
-
350
-
351
-
352
-
353
-
354
-
355
-
356
-
357
-
358
-
359
-
360
-
361
-
362
-
363
-
364
-
365
-
366
-
367
-
368
-
369
-
370
-
371
-
372
-
373
-
374
-
375
-
376
-
377
-
378
-
379
-
380
-
381
-
382
-
383
-
384
-
385
-
386
-
387
-
388
-
389
-
390
-
391
-
392
-
393
-
394
-
395
-
396
-
397
-
398
-
399
-
400
-
401
-
402
-
403
-
404
-
405
-
406
-
407
-
408
-
409
-
410
-
411
-
412
-
413
-
414
-
415
-
416
-
417
-
418
-
419
-
420
-
421
-
422
-
423
-
424
-
425
-
426
-
427
-
428
-
429
-
430
-
431
-
432
-
433
-
434
-
435
-
436
-
437
-
438
-
439
-
440
-
441
-
442
-
443
-
444
-
445
-
446
-
447
-
448
-
449
-
450
-
451
-
452
-
453
-
454
-
455
-
456
-
457
-
458
-
459
-
460
-
461
-
462
-
463
-
464
-
465
-
466
-
467
-
468
-
469
-
470
-
471
-
472
-
473
-
474
-
475
-
476
-
477
-
478
-
479
-
480
-
481
-
482
-
483
-
484
-
485
-
486
-
487
-
488
-
489
-
490
-
491
-
492
-
493
-
494
-
495
-
496
-
497
-
498
-
499
-
500
-
501
-
502
-
503
-
504
-
505
-
506
-
507
-
508
-
509
-
510
-
511
-
512
-
513
-
514
-
515
-
516
-
517
-
518
-
519
-
520
-
521
-
522
-
523
-
524
-
525
-
526
-
527
-
528
-
529
-
530
-
531
-
532
-
533
-
534
-
535
-
536
-
537
-
538
-
539
-
540
-
541
-
542
-
543
-
544
-
545
-
546
-
547
-
548
-
549
-
550
-
551
-
552
-
553
-
554
-
555
-
556
-
557
-
558
-
559
-
560
-
561
-
562
-
563
-
564
 |
 |

Business review Risk and balance sheet management
331
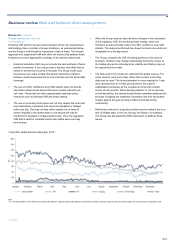
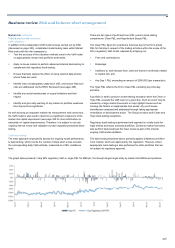
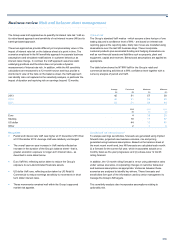
VaR back-testing*
For the Group’s trading book, a green model status was maintained
throughout 2013. For details of back-testing results for regulatory VaR,
refer to the table on page 327.
Regulatory SVaR*
The Group’s SVaR model has also been approved by the PRA for use in
the capital requirement calculation. The regulatory SVaR differs from
internal SVaR as it covers only regulator-approved products, locations
and legal entities.
Risks not in VaR (RNIVs)*
As discussed earlier, the Group has an established RNIV framework that
ensures that the risks not captured in VaR are adequately covered by its
capital.
The RNIV framework does not include tail event risks; these risks are
covered indirectly by the regulatory multiplier applied to VaR and directly
by relevant charges, e.g. IRC, APR and gap risk discussed below.
Gap risk*
Certain traded products are structured with buffers so that losses below a
certain level are borne by the Group’s counterparties. These products
may, however, exhibit large sudden market movements in excess of their
buffer, which may result in losses for the Group. The VaR model does not
fully capture the risk to the Group presented by these products. The gap
risk model takes into account the liquidity of the products and the likely
effectiveness of the buffer and produces an additional capital requirement
for the relevant products.
This risk is concentrated in the equities business in Markets. Markets’
exposure to gap risk was not material in 2013 as the portfolios
considered under this framework have been significantly reduced.
Incremental risk charge (IRC)*
The IRC model aims to quantify the impact of defaults and rating changes
on the market value of bonds, credit derivatives and other related
positions held in the trading book. It also captures basis risks between
different instruments, different product maturities and different but related
reference entities. Like the internal ratings-based approach for credit risk,
it is calculated over a one-year holding period at a 99.9% confidence
level.
*unaudited
The multivariate behaviour of positions is modelled via the relevant
reference entities using a single-factor model (Gaussian Copula), which
allows a more efficient calculation of the charge using numerical
integration.
The model is mainly driven by three-month transition, default and
correlation parameters. The portfolio impact of correlated defaults and
rating changes is assessed with reference to the resulting change in the
market value of positions, which is determined using stressed recovery
rates and modelled credit spread changes. Individual instrument
revaluation vectors are used to capture non-linear behaviour.
The model has different parameters for sovereign and corporate
exposures. The model reflects the overall liquidity of each position
referencing an entity, arising from product type, product maturity and
product concentration characteristics.
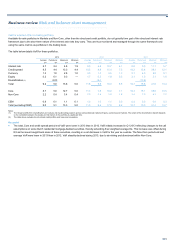
A constant level of risk is assumed and achieved by replacing positions
that default or migrate in one period with equivalent positions. The
average liquidity horizon at the year end was 3.7 months (2012 - 4.6
months).
All price risk (APR)*
The APR model determines the capital that should be held against all
material price risks, including those arising from defaults and credit rating
changes affecting securities in the hedged portfolio, using a 99.9%
confidence level over a one year time horizon.
This model is applied to the correlation trading portfolio subject to certain
eligibility criteria (principally that the underlying names be liquid corporate
CDS positions).
The most significant risks are credit spread risk, credit (base) correlation
risk, index basis risk, default risk and recovery rate risk. In addition,
losses due to both hedging costs and hedge slippage are modelled. The
overall APR capital charge is floored at 8% of the corresponding standard
rules charge for the same portfolio.
RBS no longer has market risk exposure to corporate CDOs in the
trading book. It has residual exposure to nth-to-default basket swaps,
many of which have matured. As a consequence, the APR charge for
RBS is small.