RBS 2013 Annual Report Download - page 104
Download and view the complete annual report
Please find page 104 of the 2013 RBS annual report below. You can navigate through the pages in the report by either clicking on the pages listed below, or by using the keyword search tool below to find specific information within the annual report.-
 1
1 -
2
-
3
-
4
-
5
-
6
-
7
-
8
-
9
-
10
-
11
-
12
-
13
-
14
-
15
-
16
-
17
-
18
-
19
-
20
-
21
-
22
-
23
-
24
-
25
-
26
-
27
-
28
-
29
-
30
-
31
-
32
-
33
-
34
-
35
-
36
-
37
-
38
-
39
-
40
-
41
-
42
-
43
-
44
-
45
-
46
-
47
-
48
-
49
-
50
-
51
-
52
-
53
-
54
-
55
-
56
-
57
-
58
-
59
-
60
-
61
-
62
-
63
-
64
-
65
-
66
-
67
-
68
-
69
-
70
-
71
-
72
-
73
-
74
-
75
-
76
-
77
-
78
-
79
-
80
-
81
-
82
-
83
-
84
-
85
-
86
-
87
-
88
-
89
-
90
-
91
-
92
-
93
-
 94
94 -
 95
95 -
 96
96 -
 97
97 -
 98
98 -
 99
99 -
 100
100 -
 101
101 -
 102
102 -
 103
103 -
 104
104 -
 105
105 -
 106
106 -
 107
107 -
 108
108 -
 109
109 -
 110
110 -
 111
111 -
 112
112 -
 113
113 -
 114
114 -
115
-
116
-
117
-
118
-
119
-
120
-
121
-
122
-
123
-
124
-
125
-
126
-
127
-
128
-
129
-
130
-
131
-
132
-
133
-
134
-
135
-
136
-
137
-
138
-
139
-
140
-
141
-
142
-
143
-
144
-
145
-
146
-
147
-
148
-
149
-
150
-
151
-
152
-
153
-
154
-
155
-
156
-
157
-
158
-
159
-
160
-
161
-
162
-
163
-
164
-
165
-
166
-
167
-
168
-
169
-
170
-
171
-
172
-
173
-
174
-
175
-
176
-
177
-
178
-
179
-
180
-
181
-
182
-
183
-
184
-
185
-
186
-
187
-
188
-
189
-
190
-
191
-
192
-
193
-
194
-
195
-
196
-
197
-
198
-
199
-
200
-
201
-
202
-
203
-
204
-
205
-
206
-
207
-
208
-
209
-
210
-
211
-
212
-
213
-
214
-
215
-
216
-
217
-
218
-
219
-
220
-
221
-
222
-
223
-
224
-
225
-
226
-
227
-
228
-
229
-
230
-
231
-
232
-
233
-
234
-
235
-
236
-
237
-
238
-
239
-
240
-
241
-
242
-
243
-
244
-
245
-
246
-
247
-
248
-
249
-
250
-
251
-
252
-
253
-
254
-
255
-
256
-
257
-
258
-
259
-
260
-
261
-
262
-
263
-
264
-
265
-
266
-
267
-
268
-
269
-
270
-
271
-
272
-
273
-
274
-
275
-
276
-
277
-
278
-
279
-
280
-
281
-
282
-
283
-
284
-
285
-
286
-
287
-
288
-
289
-
290
-
291
-
292
-
293
-
294
-
295
-
296
-
297
-
298
-
299
-
300
-
301
-
302
-
303
-
304
-
305
-
306
-
307
-
308
-
309
-
310
-
311
-
312
-
313
-
314
-
315
-
316
-
317
-
318
-
319
-
320
-
321
-
322
-
323
-
324
-
325
-
326
-
327
-
328
-
329
-
330
-
331
-
332
-
333
-
334
-
335
-
336
-
337
-
338
-
339
-
340
-
341
-
342
-
343
-
344
-
345
-
346
-
347
-
348
-
349
-
350
-
351
-
352
-
353
-
354
-
355
-
356
-
357
-
358
-
359
-
360
-
361
-
362
-
363
-
364
-
365
-
366
-
367
-
368
-
369
-
370
-
371
-
372
-
373
-
374
-
375
-
376
-
377
-
378
-
379
-
380
-
381
-
382
-
383
-
384
-
385
-
386
-
387
-
388
-
389
-
390
-
391
-
392
-
393
-
394
-
395
-
396
-
397
-
398
-
399
-
400
-
401
-
402
-
403
-
404
-
405
-
406
-
407
-
408
-
409
-
410
-
411
-
412
-
413
-
414
-
415
-
416
-
417
-
418
-
419
-
420
-
421
-
422
-
423
-
424
-
425
-
426
-
427
-
428
-
429
-
430
-
431
-
432
-
433
-
434
-
435
-
436
-
437
-
438
-
439
-
440
-
441
-
442
-
443
-
444
-
445
-
446
-
447
-
448
-
449
-
450
-
451
-
452
-
453
-
454
-
455
-
456
-
457
-
458
-
459
-
460
-
461
-
462
-
463
-
464
-
465
-
466
-
467
-
468
-
469
-
470
-
471
-
472
-
473
-
474
-
475
-
476
-
477
-
478
-
479
-
480
-
481
-
482
-
483
-
484
-
485
-
486
-
487
-
488
-
489
-
490
-
491
-
492
-
493
-
494
-
495
-
496
-
497
-
498
-
499
-
500
-
501
-
502
-
503
-
504
-
505
-
506
-
507
-
508
-
509
-
510
-
511
-
512
-
513
-
514
-
515
-
516
-
517
-
518
-
519
-
520
-
521
-
522
-
523
-
524
-
525
-
526
-
527
-
528
-
529
-
530
-
531
-
532
-
533
-
534
-
535
-
536
-
537
-
538
-
539
-
540
-
541
-
542
-
543
-
544
-
545
-
546
-
547
-
548
-
549
-
550
-
551
-
552
-
553
-
554
-
555
-
556
-
557
-
558
-
559
-
560
-
561
-
562
-
563
-
564
 |
 |

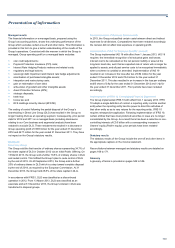
Presentation of information
102
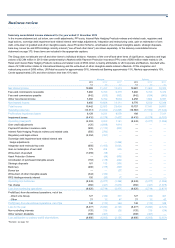
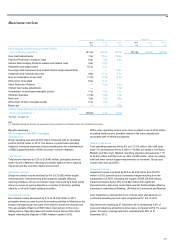
Managed results
The financial information on a managed basis, prepared using the
Group’s accounting policies, shows the underlying performance of the
Group which excludes certain one-off and other items. This information is
provided in this form to give a better understanding of the results of the
Group’s operations. Consistent with the manner in which the Group is
managed, Group operating profit on a managed basis excludes:
• own credit adjustments;
• Payment Protection Insurance (PPI) costs;
• Interest Rate Hedging Products redress and related costs;
• regulatory and legal actions;
• sovereign debt impairment and interest rate hedge adjustments;
• amortisation of purchased intangible assets;
• integration and restructuring costs;
• gain on redemption of own debt;
• write-down of goodwill and other intangible assets;
• Asset Protection Scheme (APS);
• strategic disposals;
• bank levy;
• bonus tax; and
• RFS Holdings minority interest (RFS MI)
The ceding of control following the partial disposal of the Group’s
shareholding in Direct Line Group (DLG) has resulted in the Group no
longer treating DLG as an operating segment. Consequently, prior period
data for 2012 and 2011 on a managed basis (including disclosures
relating to our Core business and segmental analysis) have been
restated to exclude DLG. These restatements resulted in a decrease in
Group operating profit of £398 million for the year ended 31 December
2012 and £477 million for the year ended 31 December 2011. They have
no impact on the Group's statutory results.
Revisions
Direct Line Group
The Group sold the first tranche of ordinary shares representing 34.7% of
the share capital of DLG in October 2012 via an Initial Public Offering. On
13 March 2013, the Group sold a further 16.8% of ordinary shares in DLG
and ceded control. This fulfilled the Group’s plan to cede control of DLG
by the end of 2013. On 20 September 2013, the Group sold a further
20% of ordinary shares in DLG which is a step toward complete disposal
by the end of 2014, as required by the European Commission. At 31
December 2013, the Group held 28.5% of the share capital in DLG.
In accordance with IFRS 5, DLG was classified as a discontinued
operation in 2012. From 13 March 2013, DLG was classified as an
associate and at 31 December 2013, the Group’s interest in DLG was
transferred to disposal groups.
Revised allocation of Business Services costs
In 2013, the Group reclassified certain costs between direct and indirect
expenses for all divisions. Comparatives have been restated accordingly;
the revision did not affect total expenses or operating profit.
Implementation of IAS 19 ‘Employee Benefits’ (revised)
The Group implemented IAS 19 with effect from 1 January 2013. IAS 19
requires: the immediate recognition of all actuarial gains and losses;
interest cost to be calculated on the net pension liability or asset at the
long-term bond rate, such that an expected rate of return will no longer be
applied to assets; and all past service costs to be recognised immediately
when a scheme is curtailed or amended. Implementation of IAS 19
resulted in an increase in the loss after tax of £84 million for the year
ended 31 December 2012 and £154 million for the year ended 31
December 2011. This also resulted in an increase in the loss per ordinary
and B share of 0.8p for the year ended 31 December 2012 and 1.4p for
the year ended 31 December 2011. Prior periods have been restated
accordingly.
Implementation of IFRS 10 ‘Consolidated Financial Statements’
The Group implemented IFRS 10 with effect from 1 January 2013. IFRS
10 adopts a single definition of control: a reporting entity controls another
entity when the reporting entity has the power to direct the activities of
that other entity so as to vary returns for the reporting entity. IFRS 10
requires retrospective application. Following implementation of IFRS 10,
certain entities that have trust preferred securities in issue are no longer
consolidated by the Group. As a result there has been a reduction in non-
controlling interests of £0.5 billion with a corresponding increase in
Owners’ equity (Paid-in equity); prior periods have been restated
accordingly.
Statutory results
The statutory results of the Group include the one-off and other items in
the appropriate captions in the income statement.
Reconciliations between managed and statutory results are detailed on
pages 169 to 171.
Glossary
A glossary of terms is provided on pages 549 to 556.