RBS 2013 Annual Report Download - page 268
Download and view the complete annual report
Please find page 268 of the 2013 RBS annual report below. You can navigate through the pages in the report by either clicking on the pages listed below, or by using the keyword search tool below to find specific information within the annual report.-
 1
1 -
2
-
3
-
4
-
5
-
6
-
7
-
8
-
9
-
10
-
11
-
12
-
13
-
14
-
15
-
16
-
17
-
18
-
19
-
20
-
21
-
22
-
23
-
24
-
25
-
26
-
27
-
28
-
29
-
30
-
31
-
32
-
33
-
34
-
35
-
36
-
37
-
38
-
39
-
40
-
41
-
42
-
43
-
44
-
45
-
46
-
47
-
48
-
49
-
50
-
51
-
52
-
53
-
54
-
55
-
56
-
57
-
58
-
59
-
60
-
61
-
62
-
63
-
64
-
65
-
66
-
67
-
68
-
69
-
70
-
71
-
72
-
73
-
74
-
75
-
76
-
77
-
78
-
79
-
80
-
81
-
82
-
83
-
84
-
85
-
86
-
87
-
88
-
89
-
90
-
91
-
92
-
93
-
94
-
95
-
96
-
97
-
98
-
99
-
100
-
101
-
102
-
103
-
104
-
105
-
106
-
107
-
108
-
109
-
110
-
111
-
112
-
113
-
114
-
115
-
116
-
117
-
118
-
119
-
120
-
121
-
122
-
123
-
124
-
125
-
126
-
127
-
128
-
129
-
130
-
131
-
132
-
133
-
134
-
135
-
136
-
137
-
138
-
139
-
140
-
141
-
142
-
143
-
144
-
145
-
146
-
147
-
148
-
149
-
150
-
151
-
152
-
153
-
154
-
155
-
156
-
157
-
158
-
159
-
160
-
161
-
162
-
163
-
164
-
165
-
166
-
167
-
168
-
169
-
170
-
171
-
172
-
173
-
174
-
175
-
176
-
177
-
178
-
179
-
180
-
181
-
182
-
183
-
184
-
185
-
186
-
187
-
188
-
189
-
190
-
191
-
192
-
193
-
194
-
195
-
196
-
197
-
198
-
199
-
200
-
201
-
202
-
203
-
204
-
205
-
206
-
207
-
208
-
209
-
210
-
211
-
212
-
213
-
214
-
215
-
216
-
217
-
218
-
219
-
220
-
221
-
222
-
223
-
224
-
225
-
226
-
227
-
228
-
229
-
230
-
231
-
232
-
233
-
234
-
235
-
236
-
237
-
238
-
239
-
240
-
241
-
242
-
243
-
244
-
245
-
246
-
247
-
248
-
249
-
250
-
251
-
252
-
253
-
254
-
255
-
256
-
257
-
 258
258 -
 259
259 -
 260
260 -
 261
261 -
 262
262 -
 263
263 -
 264
264 -
 265
265 -
 266
266 -
 267
267 -
 268
268 -
 269
269 -
 270
270 -
 271
271 -
 272
272 -
 273
273 -
 274
274 -
 275
275 -
 276
276 -
 277
277 -
 278
278 -
279
-
280
-
281
-
282
-
283
-
284
-
285
-
286
-
287
-
288
-
289
-
290
-
291
-
292
-
293
-
294
-
295
-
296
-
297
-
298
-
299
-
300
-
301
-
302
-
303
-
304
-
305
-
306
-
307
-
308
-
309
-
310
-
311
-
312
-
313
-
314
-
315
-
316
-
317
-
318
-
319
-
320
-
321
-
322
-
323
-
324
-
325
-
326
-
327
-
328
-
329
-
330
-
331
-
332
-
333
-
334
-
335
-
336
-
337
-
338
-
339
-
340
-
341
-
342
-
343
-
344
-
345
-
346
-
347
-
348
-
349
-
350
-
351
-
352
-
353
-
354
-
355
-
356
-
357
-
358
-
359
-
360
-
361
-
362
-
363
-
364
-
365
-
366
-
367
-
368
-
369
-
370
-
371
-
372
-
373
-
374
-
375
-
376
-
377
-
378
-
379
-
380
-
381
-
382
-
383
-
384
-
385
-
386
-
387
-
388
-
389
-
390
-
391
-
392
-
393
-
394
-
395
-
396
-
397
-
398
-
399
-
400
-
401
-
402
-
403
-
404
-
405
-
406
-
407
-
408
-
409
-
410
-
411
-
412
-
413
-
414
-
415
-
416
-
417
-
418
-
419
-
420
-
421
-
422
-
423
-
424
-
425
-
426
-
427
-
428
-
429
-
430
-
431
-
432
-
433
-
434
-
435
-
436
-
437
-
438
-
439
-
440
-
441
-
442
-
443
-
444
-
445
-
446
-
447
-
448
-
449
-
450
-
451
-
452
-
453
-
454
-
455
-
456
-
457
-
458
-
459
-
460
-
461
-
462
-
463
-
464
-
465
-
466
-
467
-
468
-
469
-
470
-
471
-
472
-
473
-
474
-
475
-
476
-
477
-
478
-
479
-
480
-
481
-
482
-
483
-
484
-
485
-
486
-
487
-
488
-
489
-
490
-
491
-
492
-
493
-
494
-
495
-
496
-
497
-
498
-
499
-
500
-
501
-
502
-
503
-
504
-
505
-
506
-
507
-
508
-
509
-
510
-
511
-
512
-
513
-
514
-
515
-
516
-
517
-
518
-
519
-
520
-
521
-
522
-
523
-
524
-
525
-
526
-
527
-
528
-
529
-
530
-
531
-
532
-
533
-
534
-
535
-
536
-
537
-
538
-
539
-
540
-
541
-
542
-
543
-
544
-
545
-
546
-
547
-
548
-
549
-
550
-
551
-
552
-
553
-
554
-
555
-
556
-
557
-
558
-
559
-
560
-
561
-
562
-
563
-
564
 |
 |

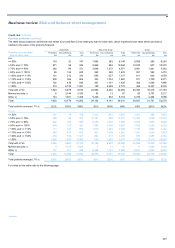
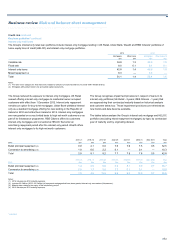
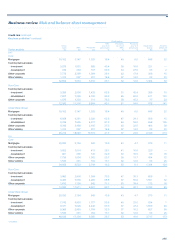
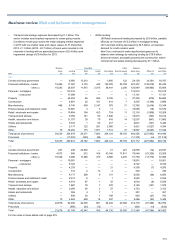
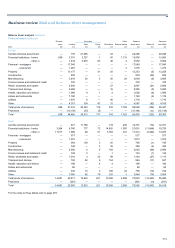
Business review Risk and balance sheet management
266
Credit risk continued
Key loan portfolios* continued
Credit metrics
REIL Provisions Provisions
Gross as a % of as a % of as a % of Impairment Amounts
loans REIL Provisions gross loans REIL gross loans charge written-off
Sector analysis £m £m £m %% % £m £m
2012
Core
Mortgages 19,162 3,147 1,525 16.4 48 8.0 646 22
Commercial real estate
- investment 3,575 1,551 593 43.4 38 16.6 221 —
- development 729 369 197 50.6 53 27.0 55 2
Other corporate 7,772 2,259 1,394 29.1 62 17.9 389 15
Other lending 1,414 207 201 14.6 97 14.2 53 33
32,652 7,533 3,910 23.1 52 12.0 1,364 72
Non-Core
Commercial real estate
- investment 3,383 2,800 1,433 82.8 51 42.4 288 15
- development 7,607 7,286 4,720 95.8 65 62.0 611 103
Other corporate 1,570 1,230 711 78.3 58 45.3 77 23
12,560 11,316 6,864 90.1 61 54.6 976 141
Ulster Bank Group
Mortgages 19,162 3,147 1,525 16.4 48 8.0 646 22
Commercial real estate
- investment 6,958 4,351 2,026 62.5 47 29.1 509 15
- development 8,336 7,655 4,917 91.8 64 59.0 666 105
Other corporate 9,342 3,489 2,105 37.3 60 22.5 466 38
Other lending 1,414 207 201 14.6 97 14.2 53 33
45,212 18,849 10,774 41.7 57 23.8 2,340 213
2011
Core
Mortgages 20,020 2,184 945 10.9 43 4.7 570 11
Commercial real estate
- investment 3,882 1,014 413 26.1 41 10.6 225 —
- development 881 290 145 32.9 50 16.5 99 16
Other corporate 7,736 1,834 1,062 23.7 58 13.7 434 72
Other lending 1,533 201 184 13.1 92 12.0 56 25
34,052 5,523 2,749 16.2 50 8.1 1,384 124
Non-Core
Commercial real estate
- investment 3,860 2,916 1,364 75.5 47 35.3 609 1
- development 8,490 7,536 4,295 88.8 57 50.6 1,551 32
Other corporate 1,630 1,159 642 71.1 55 39.4 173 16
13,980 11,611 6,301 83.1 54 45.1 2,333 49
Ulster Bank Group
Mortgages 20,020 2,184 945 10.9 43 4.7 570 11
Commercial real estate
- investment 7,742 3,930 1,777 50.8 45 23.0 834 1
- development 9,371 7,826 4,440 83.5 57 47.4 1,650 48
Other corporate 9,366 2,993 1,704 32.0 57 18.2 607 88
Other lending 1,533 201 184 13.1 92 12.0 56 25
48,032 17,134 9,050 35.7 53 18.8 3,717 173
*unaudited