RBS 2013 Annual Report Download - page 217
Download and view the complete annual report
Please find page 217 of the 2013 RBS annual report below. You can navigate through the pages in the report by either clicking on the pages listed below, or by using the keyword search tool below to find specific information within the annual report.-
 1
1 -
2
-
3
-
4
-
5
-
6
-
7
-
8
-
9
-
10
-
11
-
12
-
13
-
14
-
15
-
16
-
17
-
18
-
19
-
20
-
21
-
22
-
23
-
24
-
25
-
26
-
27
-
28
-
29
-
30
-
31
-
32
-
33
-
34
-
35
-
36
-
37
-
38
-
39
-
40
-
41
-
42
-
43
-
44
-
45
-
46
-
47
-
48
-
49
-
50
-
51
-
52
-
53
-
54
-
55
-
56
-
57
-
58
-
59
-
60
-
61
-
62
-
63
-
64
-
65
-
66
-
67
-
68
-
69
-
70
-
71
-
72
-
73
-
74
-
75
-
76
-
77
-
78
-
79
-
80
-
81
-
82
-
83
-
84
-
85
-
86
-
87
-
88
-
89
-
90
-
91
-
92
-
93
-
94
-
95
-
96
-
97
-
98
-
99
-
100
-
101
-
102
-
103
-
104
-
105
-
106
-
107
-
108
-
109
-
110
-
111
-
112
-
113
-
114
-
115
-
116
-
117
-
118
-
119
-
120
-
121
-
122
-
123
-
124
-
125
-
126
-
127
-
128
-
129
-
130
-
131
-
132
-
133
-
134
-
135
-
136
-
137
-
138
-
139
-
140
-
141
-
142
-
143
-
144
-
145
-
146
-
147
-
148
-
149
-
150
-
151
-
152
-
153
-
154
-
155
-
156
-
157
-
158
-
159
-
160
-
161
-
162
-
163
-
164
-
165
-
166
-
167
-
168
-
169
-
170
-
171
-
172
-
173
-
174
-
175
-
176
-
177
-
178
-
179
-
180
-
181
-
182
-
183
-
184
-
185
-
186
-
187
-
188
-
189
-
190
-
191
-
192
-
193
-
194
-
195
-
196
-
197
-
198
-
199
-
200
-
201
-
202
-
203
-
204
-
205
-
206
-
 207
207 -
 208
208 -
 209
209 -
 210
210 -
 211
211 -
 212
212 -
 213
213 -
 214
214 -
 215
215 -
 216
216 -
 217
217 -
 218
218 -
 219
219 -
 220
220 -
 221
221 -
 222
222 -
 223
223 -
 224
224 -
 225
225 -
 226
226 -
 227
227 -
228
-
229
-
230
-
231
-
232
-
233
-
234
-
235
-
236
-
237
-
238
-
239
-
240
-
241
-
242
-
243
-
244
-
245
-
246
-
247
-
248
-
249
-
250
-
251
-
252
-
253
-
254
-
255
-
256
-
257
-
258
-
259
-
260
-
261
-
262
-
263
-
264
-
265
-
266
-
267
-
268
-
269
-
270
-
271
-
272
-
273
-
274
-
275
-
276
-
277
-
278
-
279
-
280
-
281
-
282
-
283
-
284
-
285
-
286
-
287
-
288
-
289
-
290
-
291
-
292
-
293
-
294
-
295
-
296
-
297
-
298
-
299
-
300
-
301
-
302
-
303
-
304
-
305
-
306
-
307
-
308
-
309
-
310
-
311
-
312
-
313
-
314
-
315
-
316
-
317
-
318
-
319
-
320
-
321
-
322
-
323
-
324
-
325
-
326
-
327
-
328
-
329
-
330
-
331
-
332
-
333
-
334
-
335
-
336
-
337
-
338
-
339
-
340
-
341
-
342
-
343
-
344
-
345
-
346
-
347
-
348
-
349
-
350
-
351
-
352
-
353
-
354
-
355
-
356
-
357
-
358
-
359
-
360
-
361
-
362
-
363
-
364
-
365
-
366
-
367
-
368
-
369
-
370
-
371
-
372
-
373
-
374
-
375
-
376
-
377
-
378
-
379
-
380
-
381
-
382
-
383
-
384
-
385
-
386
-
387
-
388
-
389
-
390
-
391
-
392
-
393
-
394
-
395
-
396
-
397
-
398
-
399
-
400
-
401
-
402
-
403
-
404
-
405
-
406
-
407
-
408
-
409
-
410
-
411
-
412
-
413
-
414
-
415
-
416
-
417
-
418
-
419
-
420
-
421
-
422
-
423
-
424
-
425
-
426
-
427
-
428
-
429
-
430
-
431
-
432
-
433
-
434
-
435
-
436
-
437
-
438
-
439
-
440
-
441
-
442
-
443
-
444
-
445
-
446
-
447
-
448
-
449
-
450
-
451
-
452
-
453
-
454
-
455
-
456
-
457
-
458
-
459
-
460
-
461
-
462
-
463
-
464
-
465
-
466
-
467
-
468
-
469
-
470
-
471
-
472
-
473
-
474
-
475
-
476
-
477
-
478
-
479
-
480
-
481
-
482
-
483
-
484
-
485
-
486
-
487
-
488
-
489
-
490
-
491
-
492
-
493
-
494
-
495
-
496
-
497
-
498
-
499
-
500
-
501
-
502
-
503
-
504
-
505
-
506
-
507
-
508
-
509
-
510
-
511
-
512
-
513
-
514
-
515
-
516
-
517
-
518
-
519
-
520
-
521
-
522
-
523
-
524
-
525
-
526
-
527
-
528
-
529
-
530
-
531
-
532
-
533
-
534
-
535
-
536
-
537
-
538
-
539
-
540
-
541
-
542
-
543
-
544
-
545
-
546
-
547
-
548
-
549
-
550
-
551
-
552
-
553
-
554
-
555
-
556
-
557
-
558
-
559
-
560
-
561
-
562
-
563
-
564
 |
 |

Business review Risk and balance sheet management
215
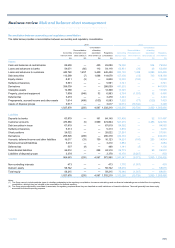
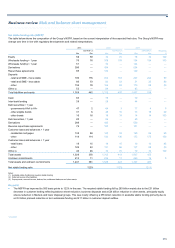
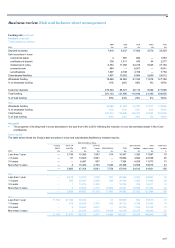
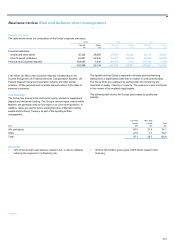
Net stable funding ratio (NSFR)*
The table below shows the composition of the Group’s NSFR, based on the current interpretation of the expected final rules. The Group’s NSFR may
change over time in line with regulatory developments and related interpretations.
2013 2012 2011
ASF/RSF (1) ASF/RSF (1) ASF/RSF (1) Weighting
£bn £bn £bn £bn £bn £bn %
Equity 59 59 70 70 76 76 100
Wholesale funding > 1 year 76 76 109 109 124 124 100
Wholesale funding < 1 year 51 — 70 — 134 — —
Derivatives 286 — 434 — 524 — —
Repurchase agreements 85 — 132 — 129 — —
Deposits
- retail and SME - more stable 196 176 203 183 227 204 90
- retail and SME - less stable 66 53 66 53 31 25 80
- other 156 78 164 82 179 89 50
Other (2) 53 — 64 — 83 — —
Total liabilities and equity 1,028 442 1,312 497 1,507 518
Cash 83 — 79 — 79 — —
Inter-bank lending 28 — 29 — 44 — —
Debt securities > 1 year
- governments AAA to AA- 47 2 64 3 77 4 5
- other eligible bonds 31 6 48 10 73 15 20
- other bonds 16 16 19 19 14 14 100
Debt securities < 1 year 20 — 26 — 45 — —
Derivatives 288 — 442 — 530 — —
Reverse repurchase agreements 76 — 105 — 101 — —
Customer loans and advances > 1 year
- residential mortgages 135 88 145 94 145 94 65
- other 114 114 136 136 173 173 100
Customer loans and advances < 1 year
- retail loans 18 15 18 15 19 16 85
- other 126 63 131 66 137 69 50
Other (3) 46 46 70 70 70 70 100
Total assets 1,028 350 1,312 413 1,507 455
Undrawn commitments 213 11 216 11 240 12 5
Total assets and undrawn commitments 1,241 361 1,528 424 1,747 467
Net stable funding ratio 122% 117% 111%
Notes:
(1) Available stable funding and required stable funding.
(2) Deferred tax and other liabilities.
(3) Prepayments, accrued income, deferred tax, settlement balances and other assets.
Key point
• The NSFR has improved by 500 basis points to 122% in the year. The required stable funding fell by £63 billion mainly due to the £31 billion
decrease in customer lending reflecting balance sheet reduction, business disposals and a £24 billion reduction in other assets, principally equity
shares reduction in Markets and lower disposal groups. This was mostly offset by a £55 billion reduction in available stable funding primarily due to
a £33 billion planned reduction in term wholesale funding and £11 billion in customer deposit outflow.
*unaudited