RBS 2013 Annual Report Download - page 215
Download and view the complete annual report
Please find page 215 of the 2013 RBS annual report below. You can navigate through the pages in the report by either clicking on the pages listed below, or by using the keyword search tool below to find specific information within the annual report.-
 1
1 -
2
-
3
-
4
-
5
-
6
-
7
-
8
-
9
-
10
-
11
-
12
-
13
-
14
-
15
-
16
-
17
-
18
-
19
-
20
-
21
-
22
-
23
-
24
-
25
-
26
-
27
-
28
-
29
-
30
-
31
-
32
-
33
-
34
-
35
-
36
-
37
-
38
-
39
-
40
-
41
-
42
-
43
-
44
-
45
-
46
-
47
-
48
-
49
-
50
-
51
-
52
-
53
-
54
-
55
-
56
-
57
-
58
-
59
-
60
-
61
-
62
-
63
-
64
-
65
-
66
-
67
-
68
-
69
-
70
-
71
-
72
-
73
-
74
-
75
-
76
-
77
-
78
-
79
-
80
-
81
-
82
-
83
-
84
-
85
-
86
-
87
-
88
-
89
-
90
-
91
-
92
-
93
-
94
-
95
-
96
-
97
-
98
-
99
-
100
-
101
-
102
-
103
-
104
-
105
-
106
-
107
-
108
-
109
-
110
-
111
-
112
-
113
-
114
-
115
-
116
-
117
-
118
-
119
-
120
-
121
-
122
-
123
-
124
-
125
-
126
-
127
-
128
-
129
-
130
-
131
-
132
-
133
-
134
-
135
-
136
-
137
-
138
-
139
-
140
-
141
-
142
-
143
-
144
-
145
-
146
-
147
-
148
-
149
-
150
-
151
-
152
-
153
-
154
-
155
-
156
-
157
-
158
-
159
-
160
-
161
-
162
-
163
-
164
-
165
-
166
-
167
-
168
-
169
-
170
-
171
-
172
-
173
-
174
-
175
-
176
-
177
-
178
-
179
-
180
-
181
-
182
-
183
-
184
-
185
-
186
-
187
-
188
-
189
-
190
-
191
-
192
-
193
-
194
-
195
-
196
-
197
-
198
-
199
-
200
-
201
-
202
-
203
-
204
-
 205
205 -
 206
206 -
 207
207 -
 208
208 -
 209
209 -
 210
210 -
 211
211 -
 212
212 -
 213
213 -
 214
214 -
 215
215 -
 216
216 -
 217
217 -
 218
218 -
 219
219 -
 220
220 -
 221
221 -
 222
222 -
 223
223 -
 224
224 -
 225
225 -
226
-
227
-
228
-
229
-
230
-
231
-
232
-
233
-
234
-
235
-
236
-
237
-
238
-
239
-
240
-
241
-
242
-
243
-
244
-
245
-
246
-
247
-
248
-
249
-
250
-
251
-
252
-
253
-
254
-
255
-
256
-
257
-
258
-
259
-
260
-
261
-
262
-
263
-
264
-
265
-
266
-
267
-
268
-
269
-
270
-
271
-
272
-
273
-
274
-
275
-
276
-
277
-
278
-
279
-
280
-
281
-
282
-
283
-
284
-
285
-
286
-
287
-
288
-
289
-
290
-
291
-
292
-
293
-
294
-
295
-
296
-
297
-
298
-
299
-
300
-
301
-
302
-
303
-
304
-
305
-
306
-
307
-
308
-
309
-
310
-
311
-
312
-
313
-
314
-
315
-
316
-
317
-
318
-
319
-
320
-
321
-
322
-
323
-
324
-
325
-
326
-
327
-
328
-
329
-
330
-
331
-
332
-
333
-
334
-
335
-
336
-
337
-
338
-
339
-
340
-
341
-
342
-
343
-
344
-
345
-
346
-
347
-
348
-
349
-
350
-
351
-
352
-
353
-
354
-
355
-
356
-
357
-
358
-
359
-
360
-
361
-
362
-
363
-
364
-
365
-
366
-
367
-
368
-
369
-
370
-
371
-
372
-
373
-
374
-
375
-
376
-
377
-
378
-
379
-
380
-
381
-
382
-
383
-
384
-
385
-
386
-
387
-
388
-
389
-
390
-
391
-
392
-
393
-
394
-
395
-
396
-
397
-
398
-
399
-
400
-
401
-
402
-
403
-
404
-
405
-
406
-
407
-
408
-
409
-
410
-
411
-
412
-
413
-
414
-
415
-
416
-
417
-
418
-
419
-
420
-
421
-
422
-
423
-
424
-
425
-
426
-
427
-
428
-
429
-
430
-
431
-
432
-
433
-
434
-
435
-
436
-
437
-
438
-
439
-
440
-
441
-
442
-
443
-
444
-
445
-
446
-
447
-
448
-
449
-
450
-
451
-
452
-
453
-
454
-
455
-
456
-
457
-
458
-
459
-
460
-
461
-
462
-
463
-
464
-
465
-
466
-
467
-
468
-
469
-
470
-
471
-
472
-
473
-
474
-
475
-
476
-
477
-
478
-
479
-
480
-
481
-
482
-
483
-
484
-
485
-
486
-
487
-
488
-
489
-
490
-
491
-
492
-
493
-
494
-
495
-
496
-
497
-
498
-
499
-
500
-
501
-
502
-
503
-
504
-
505
-
506
-
507
-
508
-
509
-
510
-
511
-
512
-
513
-
514
-
515
-
516
-
517
-
518
-
519
-
520
-
521
-
522
-
523
-
524
-
525
-
526
-
527
-
528
-
529
-
530
-
531
-
532
-
533
-
534
-
535
-
536
-
537
-
538
-
539
-
540
-
541
-
542
-
543
-
544
-
545
-
546
-
547
-
548
-
549
-
550
-
551
-
552
-
553
-
554
-
555
-
556
-
557
-
558
-
559
-
560
-
561
-
562
-
563
-
564
 |
 |

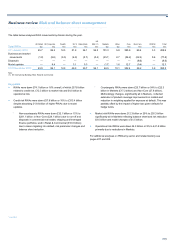
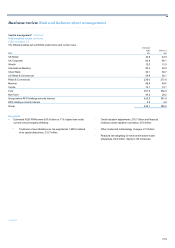
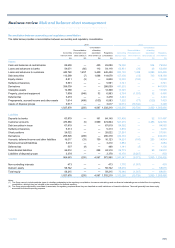
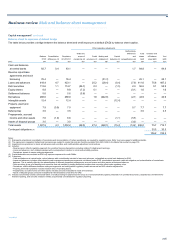
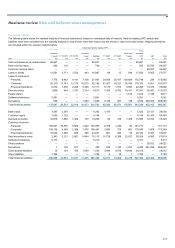
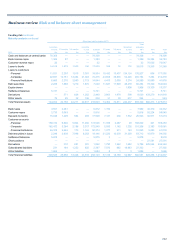
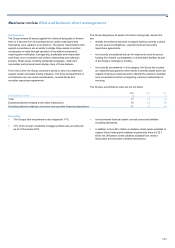
Business review Risk and balance sheet management
213
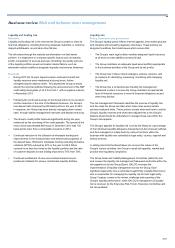
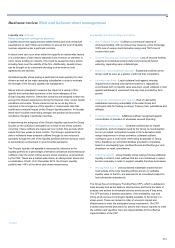
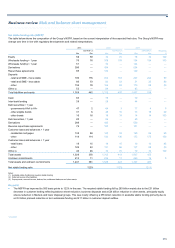
Liquidity reserves
Liquidity risks are mitigated by the Group’s centrally managed liquidity
portfolio. The size of the portfolio is determined under the Group’s
liquidity risk management framework with reference to the Group’s risk
appetite.
The majority of the portfolio is centrally managed by Group Treasury,
ring-fenced from the Markets trading book, and is the ultimate
responsibility of the Group Treasurer. This portfolio is held in the PRA
regulated UK Defined Liquidity Group (UK DLG) comprising the Group’s
five UK banks: The Royal Bank of Scotland plc, National Westminster
Bank Plc, Ulster Bank Limited, Coutts & Company and Adam &
Company.
Certain of the Group's significant operating subsidiaries - RBS N.V., RBS
Citizens Financial Group, Inc. and Ulster Bank Ireland Limited - hold
locally managed portfolios of liquid assets that comply with local
regulations but differ from PRA rules. These portfolios are the
responsibility of the local Treasurer who reports to the Group Treasurer.
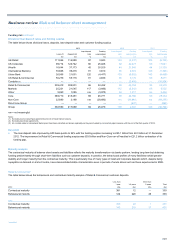
The UK DLG liquidity portfolio accounted for c.88% of the Group’s total
liquidity portfolio, this portion is available to meet liquidity needs as they
arise across the Group. The remaining liquidity reserves are held locally
within non-UK bank subsidiaries, the majority of this portion is restricted
by regulatory requirements and therefore assumed to be restricted and
only be available for use locally.
Separately from the liquidity portfolio, the Group holds high quality assets
to meet payment systems collateral requirements, these assets are not
freely available to other areas of the Group.
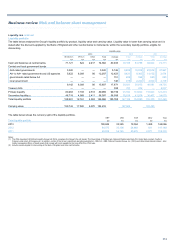
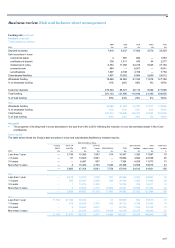
The Group categorises its liquidity portfolio, including its locally managed
liquidity portfolios, into primary and secondary liquid assets.
Primary liquid assets generally comprise eligible liquid assets, such as
cash and balances at central banks, treasury bills and other high quality
government and US agency bonds.
Secondary liquid assets comprise other assets that are eligible as
collateral for local central bank liquidity facilities but do not meet the core
local regulatory definition. These assets include own-issued
securitisations or whole loans that are retained on balance sheet and pre-
positioned with a central bank so that they may be converted into
additional sources of liquidity at very short notice.
The composition of the liquidity portfolio is influenced by quality of
counterparty, maturity mix and currency mix. The PRA rules dictate
certain minimum quality standards for the UK DLG liquidity portfolio. The
liquidity value of the portfolio is determined with reference to current
market prices and the haircuts necessary to generate cash from the
asset.
The Group in consultation with the PRA and subject to the requirements
of the PRA’s ILG can change the composition of its liquidity portfolio. The
change in composition may relate to market specific factors, changes in
internal liquidity risk mix or regulatory guidance.
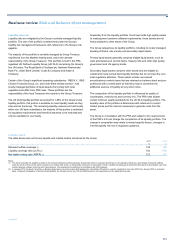
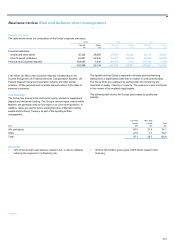
Liquidity metrics*
The table below sets out the key liquidity and related metrics monitored by the Group.
2013 2012
% %
Stressed outflow coverage (1) 145 128
Liquidity coverage ratio (LCR) (2) 102 >100
Net stable funding ratio (NSFR) (2) 122 117
Notes:
(1) The Group’s liquidity risk appetite is based on the internal Individual Liquidity Adequacy Assessment which is measured by reference to the liquidity portfolio as a percentage of stressed outflows
under the worst of three severe stress scenarios of a market-wide stress, an idiosyncratic stress and a combination of both. Liquidity risk adequacy is determined by surplus of liquid assets over three
months stressed outflows under the worst case stresses. This assessment is performed in accordance with PRA guidance.
(2) In January 2013, the Basel Committee on Banking Supervision issued its revised draft guidance for calculating LCR which is currently expected to come into effect from January 2015 on a phased
basis. Pending the finalisation of the technical standards, the Group monitors the LCR and NSFR based on its interpretations of the expected final rules.
*unaudited