RBS 2013 Annual Report Download - page 212
Download and view the complete annual report
Please find page 212 of the 2013 RBS annual report below. You can navigate through the pages in the report by either clicking on the pages listed below, or by using the keyword search tool below to find specific information within the annual report.-
 1
1 -
2
-
3
-
4
-
5
-
6
-
7
-
8
-
9
-
10
-
11
-
12
-
13
-
14
-
15
-
16
-
17
-
18
-
19
-
20
-
21
-
22
-
23
-
24
-
25
-
26
-
27
-
28
-
29
-
30
-
31
-
32
-
33
-
34
-
35
-
36
-
37
-
38
-
39
-
40
-
41
-
42
-
43
-
44
-
45
-
46
-
47
-
48
-
49
-
50
-
51
-
52
-
53
-
54
-
55
-
56
-
57
-
58
-
59
-
60
-
61
-
62
-
63
-
64
-
65
-
66
-
67
-
68
-
69
-
70
-
71
-
72
-
73
-
74
-
75
-
76
-
77
-
78
-
79
-
80
-
81
-
82
-
83
-
84
-
85
-
86
-
87
-
88
-
89
-
90
-
91
-
92
-
93
-
94
-
95
-
96
-
97
-
98
-
99
-
100
-
101
-
102
-
103
-
104
-
105
-
106
-
107
-
108
-
109
-
110
-
111
-
112
-
113
-
114
-
115
-
116
-
117
-
118
-
119
-
120
-
121
-
122
-
123
-
124
-
125
-
126
-
127
-
128
-
129
-
130
-
131
-
132
-
133
-
134
-
135
-
136
-
137
-
138
-
139
-
140
-
141
-
142
-
143
-
144
-
145
-
146
-
147
-
148
-
149
-
150
-
151
-
152
-
153
-
154
-
155
-
156
-
157
-
158
-
159
-
160
-
161
-
162
-
163
-
164
-
165
-
166
-
167
-
168
-
169
-
170
-
171
-
172
-
173
-
174
-
175
-
176
-
177
-
178
-
179
-
180
-
181
-
182
-
183
-
184
-
185
-
186
-
187
-
188
-
189
-
190
-
191
-
192
-
193
-
194
-
195
-
196
-
197
-
198
-
199
-
200
-
201
-
 202
202 -
 203
203 -
 204
204 -
 205
205 -
 206
206 -
 207
207 -
 208
208 -
 209
209 -
 210
210 -
 211
211 -
 212
212 -
 213
213 -
 214
214 -
 215
215 -
 216
216 -
 217
217 -
 218
218 -
 219
219 -
 220
220 -
 221
221 -
 222
222 -
223
-
224
-
225
-
226
-
227
-
228
-
229
-
230
-
231
-
232
-
233
-
234
-
235
-
236
-
237
-
238
-
239
-
240
-
241
-
242
-
243
-
244
-
245
-
246
-
247
-
248
-
249
-
250
-
251
-
252
-
253
-
254
-
255
-
256
-
257
-
258
-
259
-
260
-
261
-
262
-
263
-
264
-
265
-
266
-
267
-
268
-
269
-
270
-
271
-
272
-
273
-
274
-
275
-
276
-
277
-
278
-
279
-
280
-
281
-
282
-
283
-
284
-
285
-
286
-
287
-
288
-
289
-
290
-
291
-
292
-
293
-
294
-
295
-
296
-
297
-
298
-
299
-
300
-
301
-
302
-
303
-
304
-
305
-
306
-
307
-
308
-
309
-
310
-
311
-
312
-
313
-
314
-
315
-
316
-
317
-
318
-
319
-
320
-
321
-
322
-
323
-
324
-
325
-
326
-
327
-
328
-
329
-
330
-
331
-
332
-
333
-
334
-
335
-
336
-
337
-
338
-
339
-
340
-
341
-
342
-
343
-
344
-
345
-
346
-
347
-
348
-
349
-
350
-
351
-
352
-
353
-
354
-
355
-
356
-
357
-
358
-
359
-
360
-
361
-
362
-
363
-
364
-
365
-
366
-
367
-
368
-
369
-
370
-
371
-
372
-
373
-
374
-
375
-
376
-
377
-
378
-
379
-
380
-
381
-
382
-
383
-
384
-
385
-
386
-
387
-
388
-
389
-
390
-
391
-
392
-
393
-
394
-
395
-
396
-
397
-
398
-
399
-
400
-
401
-
402
-
403
-
404
-
405
-
406
-
407
-
408
-
409
-
410
-
411
-
412
-
413
-
414
-
415
-
416
-
417
-
418
-
419
-
420
-
421
-
422
-
423
-
424
-
425
-
426
-
427
-
428
-
429
-
430
-
431
-
432
-
433
-
434
-
435
-
436
-
437
-
438
-
439
-
440
-
441
-
442
-
443
-
444
-
445
-
446
-
447
-
448
-
449
-
450
-
451
-
452
-
453
-
454
-
455
-
456
-
457
-
458
-
459
-
460
-
461
-
462
-
463
-
464
-
465
-
466
-
467
-
468
-
469
-
470
-
471
-
472
-
473
-
474
-
475
-
476
-
477
-
478
-
479
-
480
-
481
-
482
-
483
-
484
-
485
-
486
-
487
-
488
-
489
-
490
-
491
-
492
-
493
-
494
-
495
-
496
-
497
-
498
-
499
-
500
-
501
-
502
-
503
-
504
-
505
-
506
-
507
-
508
-
509
-
510
-
511
-
512
-
513
-
514
-
515
-
516
-
517
-
518
-
519
-
520
-
521
-
522
-
523
-
524
-
525
-
526
-
527
-
528
-
529
-
530
-
531
-
532
-
533
-
534
-
535
-
536
-
537
-
538
-
539
-
540
-
541
-
542
-
543
-
544
-
545
-
546
-
547
-
548
-
549
-
550
-
551
-
552
-
553
-
554
-
555
-
556
-
557
-
558
-
559
-
560
-
561
-
562
-
563
-
564
 |
 |

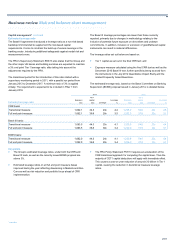
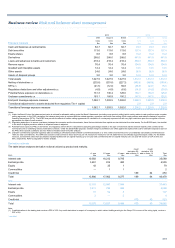
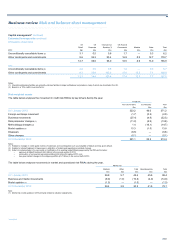
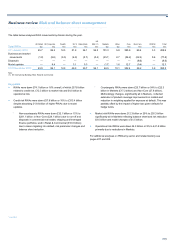
Business review Risk and balance sheet management
210
Liquidity and funding risk
Definition
Liquidity and funding risk is the risk that the Group is unable to meet its
financial obligations, including financing wholesale maturities or customer
deposit withdrawals, as and when they fall due.
The risk arises through the maturity transformation role that banks
perform. It is dependent on company specific factors such as maturity
profile, composition of sources and uses of funding, the quality and size
of the liquidity portfolio as well as broader market factors, such as
wholesale market conditions alongside depositor and investor behaviour.
Overview
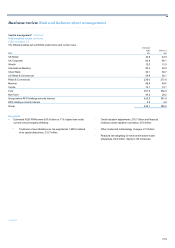
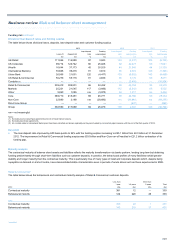
• During 2013 the Group’s deposit surplus continued to build and
liquidity reserves were maintained at strong levels, further
strengthening the balance sheet. This allowed the Group to easily
absorb the minimal outflows following the announcement of the S&P
credit rating downgrade (A-/A-2 from A/A-1, with a negative outlook)
in November 2013.
• Following the continued success of the Group’s Non-Core run-down
and the reduction in the size of the Markets business, the Group’s
loan:deposit ratio improved by 600 basis points in the year to 94%.
In response, the Group has been actively managing down excess
cash, through liability management exercises and deposit re-pricing.
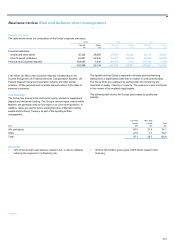
• The Group’s credit profile improved significantly during the year,
evidenced by the narrowing of the credit spreads. The spread of the
most recent subordinated debt issue in December 2013 was 125
basis points lower than a comparable issuance in 2012.
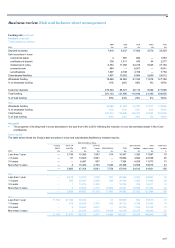
• Continued reduction in the utilisation of wholesale funding and
improvements in the characteristics and behavioural properties of
the deposit base. Short-term wholesale funding excluding derivative
collateral (STWF) reduced by 22% in the year to £32.4 billion,
covered more than four times by the liquidity portfolio and the ratio
of customer deposits to total funding improved to 75% from 70%.
• Continued enablement of new unencumbered assets as pre-
positioned collateral for various central bank liquidity facilities.
Liquidity risk
Policy, framework and governance
The Group’s liquidity policy reflects internal appetite, best market practice
and complies with prevailing regulatory structures. These policies are
designed to address four broad issues which ensure that:
• The Group’s main legal entities maintain adequate liquid resources
at all times to meet liabilities as they fall due.
• The Group maintains an adequate liquid asset portfolio appropriate
to the business activities of the Group and its risk profile.
• The Group has in place robust strategies, policies, systems, and
procedures for identifying, measuring, monitoring and managing
liquidity risk.
• The Group has a comprehensive liquidity risk management
framework in place to ensure the Group maintains an appropriate
level of financial resources to meet its financial obligations as and
when they fall due.
The risk management framework identifies the sources of liquidity risk
and the steps the Group can take when these risks exceed certain
actively monitored limits. These actions include when and how to use the
Group’s liquidity reserves and what other adjustments to the Group’s
balance sheet should be undertaken to manage these risks within the
Group’s risk appetite.
The Group’s appetite for liquidity risk is set by the Board as a percentage
of the Individual Liquidity Adequacy Assessment (ILAA) stressed outflows
and then managed on a daily basis by various functions within the
business with liquidity risk controlled at legal entity, country, regional and
divisional levels.
In setting risk limits the Board takes into account the nature of the
Group’s various activities, the Group’s overall risk appetite, market best
practice and regulatory compliance.
The Group Asset and Liability Management Committee (GALCO) sets
and reviews the liquidity risk management framework and limits within the
risk appetite set by the Group Board. GALCO oversees the
implementation of liquidity management across the Group. Each
significant legal entity has a nominated Legal Entity Liquidity Risk Owner
who is responsible for managing the liquidity risk for their legal entity.
Group Treasury conducts the review, challenge and reporting of the
Group’s liquidity performance, while GALCO’s management of liquidity
risk is overseen by the Executive Risk Forum, Executive Committee and
the Group Board.