RBS 2013 Annual Report Download - page 273
Download and view the complete annual report
Please find page 273 of the 2013 RBS annual report below. You can navigate through the pages in the report by either clicking on the pages listed below, or by using the keyword search tool below to find specific information within the annual report.-
 1
1 -
2
-
3
-
4
-
5
-
6
-
7
-
8
-
9
-
10
-
11
-
12
-
13
-
14
-
15
-
16
-
17
-
18
-
19
-
20
-
21
-
22
-
23
-
24
-
25
-
26
-
27
-
28
-
29
-
30
-
31
-
32
-
33
-
34
-
35
-
36
-
37
-
38
-
39
-
40
-
41
-
42
-
43
-
44
-
45
-
46
-
47
-
48
-
49
-
50
-
51
-
52
-
53
-
54
-
55
-
56
-
57
-
58
-
59
-
60
-
61
-
62
-
63
-
64
-
65
-
66
-
67
-
68
-
69
-
70
-
71
-
72
-
73
-
74
-
75
-
76
-
77
-
78
-
79
-
80
-
81
-
82
-
83
-
84
-
85
-
86
-
87
-
88
-
89
-
90
-
91
-
92
-
93
-
94
-
95
-
96
-
97
-
98
-
99
-
100
-
101
-
102
-
103
-
104
-
105
-
106
-
107
-
108
-
109
-
110
-
111
-
112
-
113
-
114
-
115
-
116
-
117
-
118
-
119
-
120
-
121
-
122
-
123
-
124
-
125
-
126
-
127
-
128
-
129
-
130
-
131
-
132
-
133
-
134
-
135
-
136
-
137
-
138
-
139
-
140
-
141
-
142
-
143
-
144
-
145
-
146
-
147
-
148
-
149
-
150
-
151
-
152
-
153
-
154
-
155
-
156
-
157
-
158
-
159
-
160
-
161
-
162
-
163
-
164
-
165
-
166
-
167
-
168
-
169
-
170
-
171
-
172
-
173
-
174
-
175
-
176
-
177
-
178
-
179
-
180
-
181
-
182
-
183
-
184
-
185
-
186
-
187
-
188
-
189
-
190
-
191
-
192
-
193
-
194
-
195
-
196
-
197
-
198
-
199
-
200
-
201
-
202
-
203
-
204
-
205
-
206
-
207
-
208
-
209
-
210
-
211
-
212
-
213
-
214
-
215
-
216
-
217
-
218
-
219
-
220
-
221
-
222
-
223
-
224
-
225
-
226
-
227
-
228
-
229
-
230
-
231
-
232
-
233
-
234
-
235
-
236
-
237
-
238
-
239
-
240
-
241
-
242
-
243
-
244
-
245
-
246
-
247
-
248
-
249
-
250
-
251
-
252
-
253
-
254
-
255
-
256
-
257
-
258
-
259
-
260
-
261
-
262
-
 263
263 -
 264
264 -
 265
265 -
 266
266 -
 267
267 -
 268
268 -
 269
269 -
 270
270 -
 271
271 -
 272
272 -
 273
273 -
 274
274 -
 275
275 -
 276
276 -
 277
277 -
 278
278 -
 279
279 -
 280
280 -
 281
281 -
 282
282 -
 283
283 -
284
-
285
-
286
-
287
-
288
-
289
-
290
-
291
-
292
-
293
-
294
-
295
-
296
-
297
-
298
-
299
-
300
-
301
-
302
-
303
-
304
-
305
-
306
-
307
-
308
-
309
-
310
-
311
-
312
-
313
-
314
-
315
-
316
-
317
-
318
-
319
-
320
-
321
-
322
-
323
-
324
-
325
-
326
-
327
-
328
-
329
-
330
-
331
-
332
-
333
-
334
-
335
-
336
-
337
-
338
-
339
-
340
-
341
-
342
-
343
-
344
-
345
-
346
-
347
-
348
-
349
-
350
-
351
-
352
-
353
-
354
-
355
-
356
-
357
-
358
-
359
-
360
-
361
-
362
-
363
-
364
-
365
-
366
-
367
-
368
-
369
-
370
-
371
-
372
-
373
-
374
-
375
-
376
-
377
-
378
-
379
-
380
-
381
-
382
-
383
-
384
-
385
-
386
-
387
-
388
-
389
-
390
-
391
-
392
-
393
-
394
-
395
-
396
-
397
-
398
-
399
-
400
-
401
-
402
-
403
-
404
-
405
-
406
-
407
-
408
-
409
-
410
-
411
-
412
-
413
-
414
-
415
-
416
-
417
-
418
-
419
-
420
-
421
-
422
-
423
-
424
-
425
-
426
-
427
-
428
-
429
-
430
-
431
-
432
-
433
-
434
-
435
-
436
-
437
-
438
-
439
-
440
-
441
-
442
-
443
-
444
-
445
-
446
-
447
-
448
-
449
-
450
-
451
-
452
-
453
-
454
-
455
-
456
-
457
-
458
-
459
-
460
-
461
-
462
-
463
-
464
-
465
-
466
-
467
-
468
-
469
-
470
-
471
-
472
-
473
-
474
-
475
-
476
-
477
-
478
-
479
-
480
-
481
-
482
-
483
-
484
-
485
-
486
-
487
-
488
-
489
-
490
-
491
-
492
-
493
-
494
-
495
-
496
-
497
-
498
-
499
-
500
-
501
-
502
-
503
-
504
-
505
-
506
-
507
-
508
-
509
-
510
-
511
-
512
-
513
-
514
-
515
-
516
-
517
-
518
-
519
-
520
-
521
-
522
-
523
-
524
-
525
-
526
-
527
-
528
-
529
-
530
-
531
-
532
-
533
-
534
-
535
-
536
-
537
-
538
-
539
-
540
-
541
-
542
-
543
-
544
-
545
-
546
-
547
-
548
-
549
-
550
-
551
-
552
-
553
-
554
-
555
-
556
-
557
-
558
-
559
-
560
-
561
-
562
-
563
-
564
 |
 |

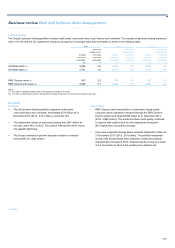
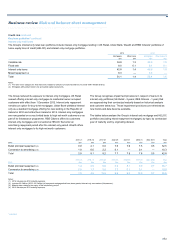
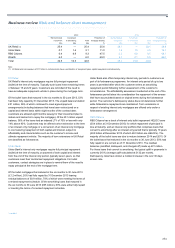
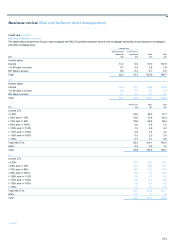
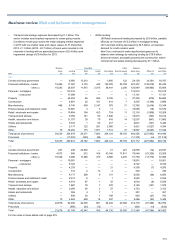
Business review Risk and balance sheet management
271
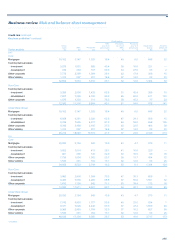
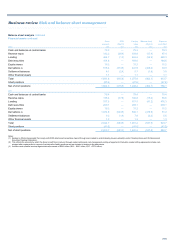
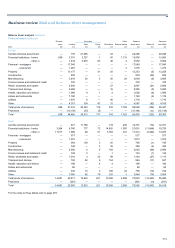
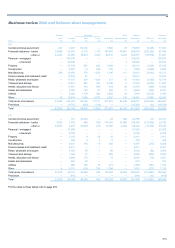
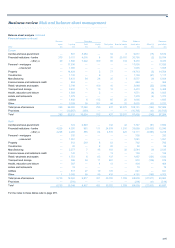
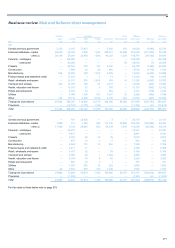
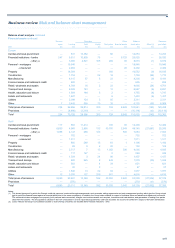
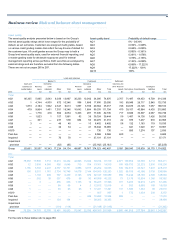
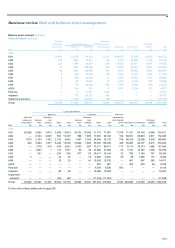
Sector and geographic concentration
The following tables analyse financial assets by sector and geography. Geographical regions are based on the location of the lending or issuer.
Reverse Securities Other Balance Exposure
repos Lending Debt Equity Derivatives financial assets sheet value Offset (1) post offset
2013 £m £m £m £m £m £m £m £m £m
Central and local government 247 8,643 70,267 — 4,049 578 83,784 (4,433) 79,351
Financial institutions - banks 26,557 27,640 7,869 688 200,091 82,661 345,506 (207,203) 138,303
- other (2) 49,156 35,948 33,219 2,538 69,851 4,859 195,571 (87,110) 108,461
Personal - mortgages — 148,533 — — — — 148,533 — 148,533
- unsecured — 28,160 — — — 6 28,166 — 28,166
Property — 62,292 225 326 2,794 — 65,637 (689) 64,948
Construction — 6,331 24 117 451 7 6,930 (1,370) 5,560
Manufacturing 466 21,377 735 2,168 1,265 43 26,054 (2,525) 23,529
Finance leases and instalment credit — 13,587 14 5 13 — 13,619 (17) 13,602
Retail, wholesale and repairs — 19,574 244 446 882 11 21,157 (1,962) 19,195
Transport and storage — 16,697 299 82 2,186 — 19,264 (866) 18,398
Health, education and leisure — 16,084 103 86 661 14 16,948 (853) 16,095
Hotels and restaurants — 6,942 5 57 218 — 7,222 (165) 7,057
Utilities — 4,960 176 285 3,271 23 8,715 (1,064) 7,651
Other 28 28,624 762 2,112 2,308 50 33,884 (2,776) 31,108
Total gross of provisions 76,454 445,392 113,942 8,910 288,040 88,252 1,020,990 (311,033) 709,957
Provisions — (25,225) (319) (99) — — (25,643) n/a (25,643)
Total 76,454 420,167 113,623 8,811 288,040 88,252 995,347 (311,033) 684,314
2012
Central and local government 441 9,853 97,339 — 5,791 591 114,015 (5,151) 108,864
Financial institutions - banks 34,783 31,394 11,555 1,643 335,521 79,308 494,204 (341,103) 153,101
- other (2) 69,256 42,198 50,104 2,672 80,817 5,591 250,638 (97,589) 153,049
Personal - mortgages — 149,625 — — — — 149,625 — 149,625
- unsecured — 32,212 — — — 4 32,216 — 32,216
Property — 72,219 774 318 4,118 — 77,429 (1,333) 76,096
Construction — 8,049 17 264 820 — 9,150 (1,687) 7,463
Manufacturing 326 23,787 836 1,639 1,759 144 28,491 (3,775) 24,716
Finance leases and instalment credit — 13,609 82 1 13 — 13,705 — 13,705
Retail, wholesale and repairs — 21,936 461 1,807 914 41 25,159 (1,785) 23,374
Transport and storage — 18,341 659 382 3,397 2 22,781 (3,240) 19,541
Health, education and leisure — 16,705 314 554 904 59 18,536 (964) 17,572
Hotels and restaurants — 7,877 144 51 493 11 8,576 (348) 8,228
Utilities — 6,631 1,311 638 3,170 50 11,800 (2,766) 9,034
Other 24 30,057 1,886 5,380 4,201 172 41,720 (2,403) 39,317
Total gross of provisions 104,830 484,493 165,482 15,349 441,918 85,973 1,298,045 (462,144) 835,901
Provisions — (21,262) (858) (112) — — (22,232) n/a (22,232)
Total 104,830 463,231 164,624 15,237 441,918 85,973 1,275,813 (462,144) 813,669
For the notes to this table refer to page 278.