RBS 2013 Annual Report Download - page 144
Download and view the complete annual report
Please find page 144 of the 2013 RBS annual report below. You can navigate through the pages in the report by either clicking on the pages listed below, or by using the keyword search tool below to find specific information within the annual report.-
 1
1 -
2
-
3
-
4
-
5
-
6
-
7
-
8
-
9
-
10
-
11
-
12
-
13
-
14
-
15
-
16
-
17
-
18
-
19
-
20
-
21
-
22
-
23
-
24
-
25
-
26
-
27
-
28
-
29
-
30
-
31
-
32
-
33
-
34
-
35
-
36
-
37
-
38
-
39
-
40
-
41
-
42
-
43
-
44
-
45
-
46
-
47
-
48
-
49
-
50
-
51
-
52
-
53
-
54
-
55
-
56
-
57
-
58
-
59
-
60
-
61
-
62
-
63
-
64
-
65
-
66
-
67
-
68
-
69
-
70
-
71
-
72
-
73
-
74
-
75
-
76
-
77
-
78
-
79
-
80
-
81
-
82
-
83
-
84
-
85
-
86
-
87
-
88
-
89
-
90
-
91
-
92
-
93
-
94
-
95
-
96
-
97
-
98
-
99
-
100
-
101
-
102
-
103
-
104
-
105
-
106
-
107
-
108
-
109
-
110
-
111
-
112
-
113
-
114
-
115
-
116
-
117
-
118
-
119
-
120
-
121
-
122
-
123
-
124
-
125
-
126
-
127
-
128
-
129
-
130
-
131
-
132
-
133
-
 134
134 -
 135
135 -
 136
136 -
 137
137 -
 138
138 -
 139
139 -
 140
140 -
 141
141 -
 142
142 -
 143
143 -
 144
144 -
 145
145 -
 146
146 -
 147
147 -
 148
148 -
 149
149 -
 150
150 -
 151
151 -
 152
152 -
 153
153 -
 154
154 -
155
-
156
-
157
-
158
-
159
-
160
-
161
-
162
-
163
-
164
-
165
-
166
-
167
-
168
-
169
-
170
-
171
-
172
-
173
-
174
-
175
-
176
-
177
-
178
-
179
-
180
-
181
-
182
-
183
-
184
-
185
-
186
-
187
-
188
-
189
-
190
-
191
-
192
-
193
-
194
-
195
-
196
-
197
-
198
-
199
-
200
-
201
-
202
-
203
-
204
-
205
-
206
-
207
-
208
-
209
-
210
-
211
-
212
-
213
-
214
-
215
-
216
-
217
-
218
-
219
-
220
-
221
-
222
-
223
-
224
-
225
-
226
-
227
-
228
-
229
-
230
-
231
-
232
-
233
-
234
-
235
-
236
-
237
-
238
-
239
-
240
-
241
-
242
-
243
-
244
-
245
-
246
-
247
-
248
-
249
-
250
-
251
-
252
-
253
-
254
-
255
-
256
-
257
-
258
-
259
-
260
-
261
-
262
-
263
-
264
-
265
-
266
-
267
-
268
-
269
-
270
-
271
-
272
-
273
-
274
-
275
-
276
-
277
-
278
-
279
-
280
-
281
-
282
-
283
-
284
-
285
-
286
-
287
-
288
-
289
-
290
-
291
-
292
-
293
-
294
-
295
-
296
-
297
-
298
-
299
-
300
-
301
-
302
-
303
-
304
-
305
-
306
-
307
-
308
-
309
-
310
-
311
-
312
-
313
-
314
-
315
-
316
-
317
-
318
-
319
-
320
-
321
-
322
-
323
-
324
-
325
-
326
-
327
-
328
-
329
-
330
-
331
-
332
-
333
-
334
-
335
-
336
-
337
-
338
-
339
-
340
-
341
-
342
-
343
-
344
-
345
-
346
-
347
-
348
-
349
-
350
-
351
-
352
-
353
-
354
-
355
-
356
-
357
-
358
-
359
-
360
-
361
-
362
-
363
-
364
-
365
-
366
-
367
-
368
-
369
-
370
-
371
-
372
-
373
-
374
-
375
-
376
-
377
-
378
-
379
-
380
-
381
-
382
-
383
-
384
-
385
-
386
-
387
-
388
-
389
-
390
-
391
-
392
-
393
-
394
-
395
-
396
-
397
-
398
-
399
-
400
-
401
-
402
-
403
-
404
-
405
-
406
-
407
-
408
-
409
-
410
-
411
-
412
-
413
-
414
-
415
-
416
-
417
-
418
-
419
-
420
-
421
-
422
-
423
-
424
-
425
-
426
-
427
-
428
-
429
-
430
-
431
-
432
-
433
-
434
-
435
-
436
-
437
-
438
-
439
-
440
-
441
-
442
-
443
-
444
-
445
-
446
-
447
-
448
-
449
-
450
-
451
-
452
-
453
-
454
-
455
-
456
-
457
-
458
-
459
-
460
-
461
-
462
-
463
-
464
-
465
-
466
-
467
-
468
-
469
-
470
-
471
-
472
-
473
-
474
-
475
-
476
-
477
-
478
-
479
-
480
-
481
-
482
-
483
-
484
-
485
-
486
-
487
-
488
-
489
-
490
-
491
-
492
-
493
-
494
-
495
-
496
-
497
-
498
-
499
-
500
-
501
-
502
-
503
-
504
-
505
-
506
-
507
-
508
-
509
-
510
-
511
-
512
-
513
-
514
-
515
-
516
-
517
-
518
-
519
-
520
-
521
-
522
-
523
-
524
-
525
-
526
-
527
-
528
-
529
-
530
-
531
-
532
-
533
-
534
-
535
-
536
-
537
-
538
-
539
-
540
-
541
-
542
-
543
-
544
-
545
-
546
-
547
-
548
-
549
-
550
-
551
-
552
-
553
-
554
-
555
-
556
-
557
-
558
-
559
-
560
-
561
-
562
-
563
-
564
 |
 |

Business review
142
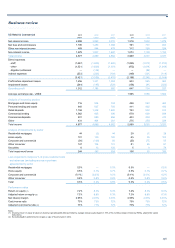
International Banking continued
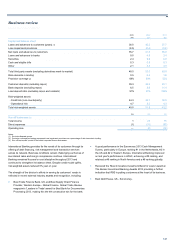
2013 compared with 2012
Operating profit, decreased by £315 million as lower income and higher
impairments, including £52 million in relation to the accelerated asset
recovery strategy associated with RCR, were only partially offset by lower
costs.
Income was 13% lower:
• Cash management was 22% lower reflecting a decline in three-
month LIBOR rates as well as increased funding costs of liquidity
buffer requirements.
• Loan portfolio decreased by 6%, in line with a smaller balance
sheet.
Expenses were down £77 million, or 5%, reflecting continued emphasis
on cost control and timely run-off of discontinued business.
Impairment losses were £118 million higher than in 2012, including two
large single-name provisions and £52 million in relation to the impact of
the accelerated RCR asset recovery strategy.
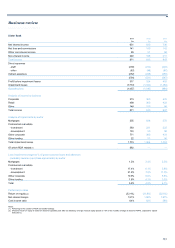
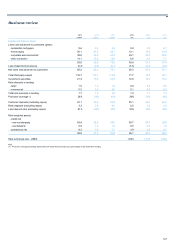
Third party assets were down 8% due to reductions in the loan portfolio
following increased levels of customer repayments partially offset by an
increase in Asia trade volume.
Customer deposits declined by 15% in line with a change in Group
funding strategy.
Risk-weighted assets decreased by 6% primarily as a result of
management action to mitigate credit model increases and a smaller
balance sheet.
Return on equity was 4% or 5% excluding the impact of the accelerated
RCR asset recovery strategy compared with 9% in 2012.
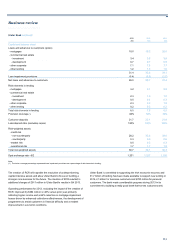
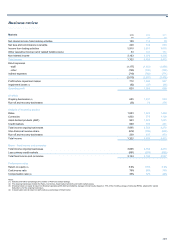
2012 compared with 2011
Operating profit decreased by £161 million as a decline in income was
only partially mitigated by lower expenses and impairment losses.
Income was 17% lower:
• Loan portfolio decreased by 32%, mainly due to a strategic
reduction in assets, in order to allocate capital more efficiently, and
the effect of portfolio credit hedging and lower corporate appetite for
risk management activities.
• Cash management was broadly in line with the previous year.
Deposit margins declined following reductions in both three month
LIBOR and five year fixed rates across Europe; however, this was
offset by lower liquidity costs due to the strategic initiative to reduce
short-term bank deposits.
• Trade finance increased by 6% as a result of increased activity,
particularly in Asia.
• The restructuring in 2012 led to a reduction in activities undertaken
in the division, which contributed to a decline in income.
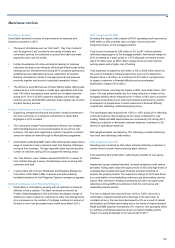
Expenses declined by £215 million, reflecting planned restructuring
initiatives following the formation of the International Banking division.
Savings were achieved through headcount reduction, run-off of
discontinued businesses and a resulting decrease in infrastructure
support costs. Revenue-linked expenses also fell in line with the
decrease in income.
Impairment losses decreased by £57 million with the non-repeat of a
single name impairment.
Third party assets declined by 24%, with targeted reductions in the
lending portfolio following a strategic reduction in assets.
Customer deposits increased by 2%. Successful efforts to rebuild
customer confidence following the Moody’s credit rating downgrade and
the Group technology incident in June 2012 outweighed economic
pressures. This, coupled with the managed reduction in loans and
advances to customers, improved the loan:deposit ratio to 91%.
Bank deposits were down 51%, mainly as a result of lower short-term
balances, reflecting a strategic initiative to reduce liquidity outflow risk.
Risk-weighted assets increased by 20%, reflecting the impact of
regulatory uplifts partially offset by successful mitigation through balance
sheet reduction. Risk-weighted asset intensity in the loan book has
increased significantly given the uplifts, which will result in strategic
adjustments going forward.