RBS 2013 Annual Report Download - page 235
Download and view the complete annual report
Please find page 235 of the 2013 RBS annual report below. You can navigate through the pages in the report by either clicking on the pages listed below, or by using the keyword search tool below to find specific information within the annual report.-
 1
1 -
2
-
3
-
4
-
5
-
6
-
7
-
8
-
9
-
10
-
11
-
12
-
13
-
14
-
15
-
16
-
17
-
18
-
19
-
20
-
21
-
22
-
23
-
24
-
25
-
26
-
27
-
28
-
29
-
30
-
31
-
32
-
33
-
34
-
35
-
36
-
37
-
38
-
39
-
40
-
41
-
42
-
43
-
44
-
45
-
46
-
47
-
48
-
49
-
50
-
51
-
52
-
53
-
54
-
55
-
56
-
57
-
58
-
59
-
60
-
61
-
62
-
63
-
64
-
65
-
66
-
67
-
68
-
69
-
70
-
71
-
72
-
73
-
74
-
75
-
76
-
77
-
78
-
79
-
80
-
81
-
82
-
83
-
84
-
85
-
86
-
87
-
88
-
89
-
90
-
91
-
92
-
93
-
94
-
95
-
96
-
97
-
98
-
99
-
100
-
101
-
102
-
103
-
104
-
105
-
106
-
107
-
108
-
109
-
110
-
111
-
112
-
113
-
114
-
115
-
116
-
117
-
118
-
119
-
120
-
121
-
122
-
123
-
124
-
125
-
126
-
127
-
128
-
129
-
130
-
131
-
132
-
133
-
134
-
135
-
136
-
137
-
138
-
139
-
140
-
141
-
142
-
143
-
144
-
145
-
146
-
147
-
148
-
149
-
150
-
151
-
152
-
153
-
154
-
155
-
156
-
157
-
158
-
159
-
160
-
161
-
162
-
163
-
164
-
165
-
166
-
167
-
168
-
169
-
170
-
171
-
172
-
173
-
174
-
175
-
176
-
177
-
178
-
179
-
180
-
181
-
182
-
183
-
184
-
185
-
186
-
187
-
188
-
189
-
190
-
191
-
192
-
193
-
194
-
195
-
196
-
197
-
198
-
199
-
200
-
201
-
202
-
203
-
204
-
205
-
206
-
207
-
208
-
209
-
210
-
211
-
212
-
213
-
214
-
215
-
216
-
217
-
218
-
219
-
220
-
221
-
222
-
223
-
224
-
 225
225 -
 226
226 -
 227
227 -
 228
228 -
 229
229 -
 230
230 -
 231
231 -
 232
232 -
 233
233 -
 234
234 -
 235
235 -
 236
236 -
 237
237 -
 238
238 -
 239
239 -
 240
240 -
 241
241 -
 242
242 -
 243
243 -
 244
244 -
 245
245 -
246
-
247
-
248
-
249
-
250
-
251
-
252
-
253
-
254
-
255
-
256
-
257
-
258
-
259
-
260
-
261
-
262
-
263
-
264
-
265
-
266
-
267
-
268
-
269
-
270
-
271
-
272
-
273
-
274
-
275
-
276
-
277
-
278
-
279
-
280
-
281
-
282
-
283
-
284
-
285
-
286
-
287
-
288
-
289
-
290
-
291
-
292
-
293
-
294
-
295
-
296
-
297
-
298
-
299
-
300
-
301
-
302
-
303
-
304
-
305
-
306
-
307
-
308
-
309
-
310
-
311
-
312
-
313
-
314
-
315
-
316
-
317
-
318
-
319
-
320
-
321
-
322
-
323
-
324
-
325
-
326
-
327
-
328
-
329
-
330
-
331
-
332
-
333
-
334
-
335
-
336
-
337
-
338
-
339
-
340
-
341
-
342
-
343
-
344
-
345
-
346
-
347
-
348
-
349
-
350
-
351
-
352
-
353
-
354
-
355
-
356
-
357
-
358
-
359
-
360
-
361
-
362
-
363
-
364
-
365
-
366
-
367
-
368
-
369
-
370
-
371
-
372
-
373
-
374
-
375
-
376
-
377
-
378
-
379
-
380
-
381
-
382
-
383
-
384
-
385
-
386
-
387
-
388
-
389
-
390
-
391
-
392
-
393
-
394
-
395
-
396
-
397
-
398
-
399
-
400
-
401
-
402
-
403
-
404
-
405
-
406
-
407
-
408
-
409
-
410
-
411
-
412
-
413
-
414
-
415
-
416
-
417
-
418
-
419
-
420
-
421
-
422
-
423
-
424
-
425
-
426
-
427
-
428
-
429
-
430
-
431
-
432
-
433
-
434
-
435
-
436
-
437
-
438
-
439
-
440
-
441
-
442
-
443
-
444
-
445
-
446
-
447
-
448
-
449
-
450
-
451
-
452
-
453
-
454
-
455
-
456
-
457
-
458
-
459
-
460
-
461
-
462
-
463
-
464
-
465
-
466
-
467
-
468
-
469
-
470
-
471
-
472
-
473
-
474
-
475
-
476
-
477
-
478
-
479
-
480
-
481
-
482
-
483
-
484
-
485
-
486
-
487
-
488
-
489
-
490
-
491
-
492
-
493
-
494
-
495
-
496
-
497
-
498
-
499
-
500
-
501
-
502
-
503
-
504
-
505
-
506
-
507
-
508
-
509
-
510
-
511
-
512
-
513
-
514
-
515
-
516
-
517
-
518
-
519
-
520
-
521
-
522
-
523
-
524
-
525
-
526
-
527
-
528
-
529
-
530
-
531
-
532
-
533
-
534
-
535
-
536
-
537
-
538
-
539
-
540
-
541
-
542
-
543
-
544
-
545
-
546
-
547
-
548
-
549
-
550
-
551
-
552
-
553
-
554
-
555
-
556
-
557
-
558
-
559
-
560
-
561
-
562
-
563
-
564
 |
 |

Business review Risk and balance sheet management
233
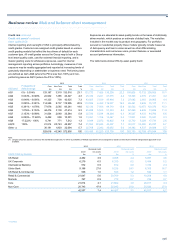
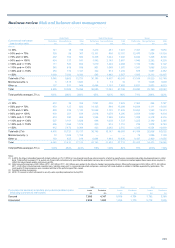
Sector and geographical regional analyses
The table below details CRA by sector and geographical region. Sectors are based on the Group’s sector concentration framework. Geographical region
is based on the location of the customer’s operations (or, in the case of individuals, location of residence).
Western
Europe North Asia Latin
UK (excl. UK) America Pacific America Other (1) Total Core Non-Core
2013 £m £m £m £m £m £m £m £m £m
Personal 127,620 18,751 28,616 1,418 61 656 177,122 174,798 2,324
Banks 2,506 25,085 3,133 9,670 1,192 1,771 43,357 43,010 347
Other financial institutions 23,080 10,363 9,164 2,633 1,320 1,100 47,660 43,849 3,811
Sovereign (2) 55,041 8,685 18,203 3,394 37 687 86,047 84,726 1,321
Property 49,639 18,673 6,206 929 286 795 76,528 53,569 22,959
Natural resources 6,698 4,587 6,189 3,669 214 2,087 23,444 21,412 2,032
Manufacturing 8,843 4,962 6,208 2,278 120 1,397 23,808 23,276 532
Transport (3) 10,332 3,936 3,959 1,800 163 9,435 29,625 24,086 5,539
Retail and leisure 16,338 3,924 4,977 738 91 517 26,585 24,562 2,023
Telecoms, media and technology 3,356 2,591 3,401 1,403 29 491 11,271 9,810 1,461
Business services 16,527 2,733 6,053 757 1,233 206 27,509 26,518 991
319,980 104,290 96,109 28,689 4,746 19,142 572,956 529,616 43,340
2012
Personal 129,431 19,256 30,664 1,351 39 926 181,667 177,880 3,787
Banks 5,023 36,573 6,421 8,837 1,435 2,711 61,000 60,609 391
Other financial institutions 20,997 13,398 10,189 2,924 4,660 789 52,957 47,425 5,532
Sovereign (2) 38,870 26,002 14,265 2,887 64 1,195 83,283 81,636 1,647
Property 54,831 23,220 7,051 1,149 2,979 1,280 90,510 56,566 33,944
Natural resources 6,103 5,911 6,758 4,129 690 1,500 25,091 21,877 3,214
Manufacturing 9,656 5,587 6,246 2,369 572 1,213 25,643 24,315 1,328
Transport (3) 12,298 5,394 4,722 5,065 2,278 4,798 34,555 26,973 7,582
Retail and leisure 17,229 5,200 4,998 1,103 270 658 29,458 26,203 3,255
Telecoms, media and technology 4,787 3,572 3,188 1,739 127 346 13,759 10,815 2,944
Business services 17,089 3,183 5,999 581 780 154 27,786 26,190 1,596
316,314 147,296 100,501 32,134 13,894 15,570 625,709 560,489 65,220
2011
Personal 126,945 20,254 33,087 1,604 158 1,114 183,162 176,201 6,961
Banks 4,720 39,213 3,952 11,132 1,738 3,276 64,031 63,470 561
Other financial institutions 16,549 15,960 13,319 3,103 5,837 1,159 55,927 45,548 10,379
Sovereign (2) 21,053 31,374 31,391 3,399 78 1,581 88,876 87,617 1,259
Property 60,099 27,281 8,052 1,370 3,471 1,480 101,753 58,323 43,430
Natural resources 6,552 7,215 8,116 3,805 1,078 2,508 29,274 25,146 4,128
Manufacturing 9,583 7,391 7,098 2,126 1,011 1,381 28,590 26,525 2,065
Transport (3) 13,789 7,703 4,951 5,433 2,500 5,363 39,739 27,529 12,210
Retail and leisure 22,775 6,101 5,762 1,488 1,041 675 37,842 32,766 5,076
Telecoms, media and technology 5,295 4,941 3,202 1,944 139 609 16,130 12,180 3,950
Business services 17,851 3,719 6,205 910 629 206 29,520 26,830 2,690
305,211 171,152 125,135 36,314 17,680 19,352 674,844 582,135 92,709
Notes:
(1) Comprises Central and Eastern Europe, the Middle East, Central Asia and Africa, and supranationals such as the World Bank.
(2) Includes cash held at central banks.
(3) Excludes net investment in operating leases in shipping and aviation portfolios as they are accounted for as property, plant and equipment. However, operating leases are included in the monitoring
and management of these portfolios.
*unaudited