RBS 2013 Annual Report Download - page 405
Download and view the complete annual report
Please find page 405 of the 2013 RBS annual report below. You can navigate through the pages in the report by either clicking on the pages listed below, or by using the keyword search tool below to find specific information within the annual report.-
 1
1 -
2
-
3
-
4
-
5
-
6
-
7
-
8
-
9
-
10
-
11
-
12
-
13
-
14
-
15
-
16
-
17
-
18
-
19
-
20
-
21
-
22
-
23
-
24
-
25
-
26
-
27
-
28
-
29
-
30
-
31
-
32
-
33
-
34
-
35
-
36
-
37
-
38
-
39
-
40
-
41
-
42
-
43
-
44
-
45
-
46
-
47
-
48
-
49
-
50
-
51
-
52
-
53
-
54
-
55
-
56
-
57
-
58
-
59
-
60
-
61
-
62
-
63
-
64
-
65
-
66
-
67
-
68
-
69
-
70
-
71
-
72
-
73
-
74
-
75
-
76
-
77
-
78
-
79
-
80
-
81
-
82
-
83
-
84
-
85
-
86
-
87
-
88
-
89
-
90
-
91
-
92
-
93
-
94
-
95
-
96
-
97
-
98
-
99
-
100
-
101
-
102
-
103
-
104
-
105
-
106
-
107
-
108
-
109
-
110
-
111
-
112
-
113
-
114
-
115
-
116
-
117
-
118
-
119
-
120
-
121
-
122
-
123
-
124
-
125
-
126
-
127
-
128
-
129
-
130
-
131
-
132
-
133
-
134
-
135
-
136
-
137
-
138
-
139
-
140
-
141
-
142
-
143
-
144
-
145
-
146
-
147
-
148
-
149
-
150
-
151
-
152
-
153
-
154
-
155
-
156
-
157
-
158
-
159
-
160
-
161
-
162
-
163
-
164
-
165
-
166
-
167
-
168
-
169
-
170
-
171
-
172
-
173
-
174
-
175
-
176
-
177
-
178
-
179
-
180
-
181
-
182
-
183
-
184
-
185
-
186
-
187
-
188
-
189
-
190
-
191
-
192
-
193
-
194
-
195
-
196
-
197
-
198
-
199
-
200
-
201
-
202
-
203
-
204
-
205
-
206
-
207
-
208
-
209
-
210
-
211
-
212
-
213
-
214
-
215
-
216
-
217
-
218
-
219
-
220
-
221
-
222
-
223
-
224
-
225
-
226
-
227
-
228
-
229
-
230
-
231
-
232
-
233
-
234
-
235
-
236
-
237
-
238
-
239
-
240
-
241
-
242
-
243
-
244
-
245
-
246
-
247
-
248
-
249
-
250
-
251
-
252
-
253
-
254
-
255
-
256
-
257
-
258
-
259
-
260
-
261
-
262
-
263
-
264
-
265
-
266
-
267
-
268
-
269
-
270
-
271
-
272
-
273
-
274
-
275
-
276
-
277
-
278
-
279
-
280
-
281
-
282
-
283
-
284
-
285
-
286
-
287
-
288
-
289
-
290
-
291
-
292
-
293
-
294
-
295
-
296
-
297
-
298
-
299
-
300
-
301
-
302
-
303
-
304
-
305
-
306
-
307
-
308
-
309
-
310
-
311
-
312
-
313
-
314
-
315
-
316
-
317
-
318
-
319
-
320
-
321
-
322
-
323
-
324
-
325
-
326
-
327
-
328
-
329
-
330
-
331
-
332
-
333
-
334
-
335
-
336
-
337
-
338
-
339
-
340
-
341
-
342
-
343
-
344
-
345
-
346
-
347
-
348
-
349
-
350
-
351
-
352
-
353
-
354
-
355
-
356
-
357
-
358
-
359
-
360
-
361
-
362
-
363
-
364
-
365
-
366
-
367
-
368
-
369
-
370
-
371
-
372
-
373
-
374
-
375
-
376
-
377
-
378
-
379
-
380
-
381
-
382
-
383
-
384
-
385
-
386
-
387
-
388
-
389
-
390
-
391
-
392
-
393
-
394
-
 395
395 -
 396
396 -
 397
397 -
 398
398 -
 399
399 -
 400
400 -
 401
401 -
 402
402 -
 403
403 -
 404
404 -
 405
405 -
 406
406 -
 407
407 -
 408
408 -
 409
409 -
 410
410 -
 411
411 -
 412
412 -
 413
413 -
 414
414 -
 415
415 -
416
-
417
-
418
-
419
-
420
-
421
-
422
-
423
-
424
-
425
-
426
-
427
-
428
-
429
-
430
-
431
-
432
-
433
-
434
-
435
-
436
-
437
-
438
-
439
-
440
-
441
-
442
-
443
-
444
-
445
-
446
-
447
-
448
-
449
-
450
-
451
-
452
-
453
-
454
-
455
-
456
-
457
-
458
-
459
-
460
-
461
-
462
-
463
-
464
-
465
-
466
-
467
-
468
-
469
-
470
-
471
-
472
-
473
-
474
-
475
-
476
-
477
-
478
-
479
-
480
-
481
-
482
-
483
-
484
-
485
-
486
-
487
-
488
-
489
-
490
-
491
-
492
-
493
-
494
-
495
-
496
-
497
-
498
-
499
-
500
-
501
-
502
-
503
-
504
-
505
-
506
-
507
-
508
-
509
-
510
-
511
-
512
-
513
-
514
-
515
-
516
-
517
-
518
-
519
-
520
-
521
-
522
-
523
-
524
-
525
-
526
-
527
-
528
-
529
-
530
-
531
-
532
-
533
-
534
-
535
-
536
-
537
-
538
-
539
-
540
-
541
-
542
-
543
-
544
-
545
-
546
-
547
-
548
-
549
-
550
-
551
-
552
-
553
-
554
-
555
-
556
-
557
-
558
-
559
-
560
-
561
-
562
-
563
-
564
 |
 |

Notes on the consolidated accounts
403
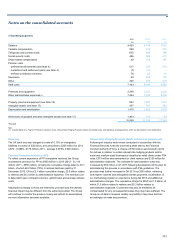
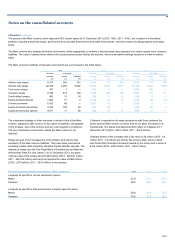
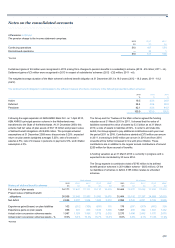
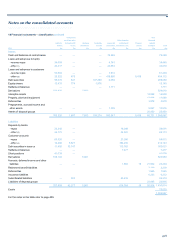
The table below sets out the sensitivities of the pension cost for the year and the present value of defined benefit obligations at 31 December to a
change in the principal actuarial assumptions:
Main scheme All schemes
(Decrease)/increase (Decrease)/increase
in pension cost in obligation in pension cost in obligation
for year at 31 December for year at 31 December
2013 2012 2011 2013 2012 2011 2013 2012 2011 2013 2012 2011
£m £m £m £m £m £m £m £m £m £m £m £m
0.25% increase in the discount rate (66) (66) (65) (1,187) (1,199) (1,019) (80) (80) (75) (1,379) (1,392) (1,181)
0.25% increase in inflation 52 60 59 895 995 911 58 66 65 1,000 1,129 1,040
0.25% additional rate of increase in
pensions in payment 42 39 37 758 690 618 48 45 42 844 782 691
0.25% additional rate of increase in
deferred pensions 18 20 21 329 297 285 21 23 23 383 342 322
0.25% additional rate of increase in
salaries 9 6 6 83 95 56 12 9 9 110 125 79
Longevity increase of one year 35 33 34 728 647 566 39 38 40 801 727 671
Pension costs and liabilities are calculated on the central assumptions and under the relevant sensitivity scenarios. The sensitivity to pension
costs/liabilities is the difference between these calculations.
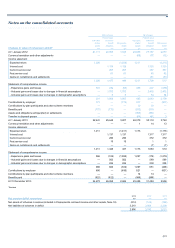
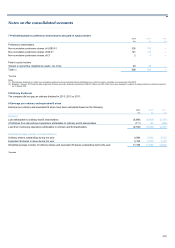
5 Auditor’s remuneration
Amounts paid to the Group's auditors for statutory audit and other services are set out below. All audit-related and other services are approved by the
Group Audit Committee and are subject to strict controls to ensure the external auditor’s independence is unaffected by the provision of other services.
The Group Audit Committee recognise that for certain assignments the auditors are best placed to perform the work economically; for other work the
Group selects the supplier best placed to meet its requirements. The Group’s auditors are permitted to tender for such work in competition with other
firms where the work is permissible under audit independence rules.
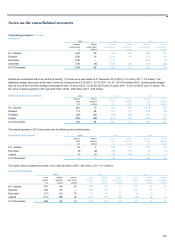
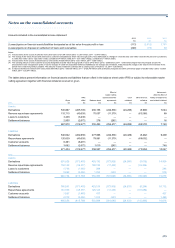
The analysis of auditor’s remuneration is as follows:
2013 2012
£m £m
Fees payable for the audit of the Group’s annual accounts 4.0 4.0
Fees payable to the auditor and its associates for other services to the Group
- the audit of the company’s subsidiaries 22.1 24.4
- audit-related assurance services (1) 3.8 4.6
Total audit and audit-related assurance services fees 29.9 33.0
Taxation compliance services 0.2 0.2
Taxation advisory services 0.1 0.1
Other assurance services 2.3 2.2
Corporate finance services (2) 0.8 5.7
Consulting services 0.2 1.5
Total other services 3.6 9.7
Fees payable to the auditor and its associates in respect of audits of associated pension schemes 0.5 0.5
Total 34.0 43.2
Notes:
(1) Comprises fees of £0.9 million (2012 - £1.0 million) in relation to reviews of interim financial information, £2.3 million (2012 - £2.9 million) in respect of reports to the Group’s regulators in the UK and
overseas, £0.3 million (2012 - £0.5 million) in respect of internal controls assurance and £0.3 million (2012 - £0.2 million) in relation to non-statutory audit opinions.
(2) Comprises fees of £0.8 million (2012 - £1.6 million) in respect of work performed by the auditors as reporting accountants on debt and equity issuances undertaken by the Group, including
securitisations. The figure for 2012 includes £4.1 million in respect of reporting accountant services in connection with divestments by the Group, which was not repeated in 2013.