RBS 2013 Annual Report Download - page 222
Download and view the complete annual report
Please find page 222 of the 2013 RBS annual report below. You can navigate through the pages in the report by either clicking on the pages listed below, or by using the keyword search tool below to find specific information within the annual report.-
 1
1 -
2
-
3
-
4
-
5
-
6
-
7
-
8
-
9
-
10
-
11
-
12
-
13
-
14
-
15
-
16
-
17
-
18
-
19
-
20
-
21
-
22
-
23
-
24
-
25
-
26
-
27
-
28
-
29
-
30
-
31
-
32
-
33
-
34
-
35
-
36
-
37
-
38
-
39
-
40
-
41
-
42
-
43
-
44
-
45
-
46
-
47
-
48
-
49
-
50
-
51
-
52
-
53
-
54
-
55
-
56
-
57
-
58
-
59
-
60
-
61
-
62
-
63
-
64
-
65
-
66
-
67
-
68
-
69
-
70
-
71
-
72
-
73
-
74
-
75
-
76
-
77
-
78
-
79
-
80
-
81
-
82
-
83
-
84
-
85
-
86
-
87
-
88
-
89
-
90
-
91
-
92
-
93
-
94
-
95
-
96
-
97
-
98
-
99
-
100
-
101
-
102
-
103
-
104
-
105
-
106
-
107
-
108
-
109
-
110
-
111
-
112
-
113
-
114
-
115
-
116
-
117
-
118
-
119
-
120
-
121
-
122
-
123
-
124
-
125
-
126
-
127
-
128
-
129
-
130
-
131
-
132
-
133
-
134
-
135
-
136
-
137
-
138
-
139
-
140
-
141
-
142
-
143
-
144
-
145
-
146
-
147
-
148
-
149
-
150
-
151
-
152
-
153
-
154
-
155
-
156
-
157
-
158
-
159
-
160
-
161
-
162
-
163
-
164
-
165
-
166
-
167
-
168
-
169
-
170
-
171
-
172
-
173
-
174
-
175
-
176
-
177
-
178
-
179
-
180
-
181
-
182
-
183
-
184
-
185
-
186
-
187
-
188
-
189
-
190
-
191
-
192
-
193
-
194
-
195
-
196
-
197
-
198
-
199
-
200
-
201
-
202
-
203
-
204
-
205
-
206
-
207
-
208
-
209
-
210
-
211
-
 212
212 -
 213
213 -
 214
214 -
 215
215 -
 216
216 -
 217
217 -
 218
218 -
 219
219 -
 220
220 -
 221
221 -
 222
222 -
 223
223 -
 224
224 -
 225
225 -
 226
226 -
 227
227 -
 228
228 -
 229
229 -
 230
230 -
 231
231 -
 232
232 -
233
-
234
-
235
-
236
-
237
-
238
-
239
-
240
-
241
-
242
-
243
-
244
-
245
-
246
-
247
-
248
-
249
-
250
-
251
-
252
-
253
-
254
-
255
-
256
-
257
-
258
-
259
-
260
-
261
-
262
-
263
-
264
-
265
-
266
-
267
-
268
-
269
-
270
-
271
-
272
-
273
-
274
-
275
-
276
-
277
-
278
-
279
-
280
-
281
-
282
-
283
-
284
-
285
-
286
-
287
-
288
-
289
-
290
-
291
-
292
-
293
-
294
-
295
-
296
-
297
-
298
-
299
-
300
-
301
-
302
-
303
-
304
-
305
-
306
-
307
-
308
-
309
-
310
-
311
-
312
-
313
-
314
-
315
-
316
-
317
-
318
-
319
-
320
-
321
-
322
-
323
-
324
-
325
-
326
-
327
-
328
-
329
-
330
-
331
-
332
-
333
-
334
-
335
-
336
-
337
-
338
-
339
-
340
-
341
-
342
-
343
-
344
-
345
-
346
-
347
-
348
-
349
-
350
-
351
-
352
-
353
-
354
-
355
-
356
-
357
-
358
-
359
-
360
-
361
-
362
-
363
-
364
-
365
-
366
-
367
-
368
-
369
-
370
-
371
-
372
-
373
-
374
-
375
-
376
-
377
-
378
-
379
-
380
-
381
-
382
-
383
-
384
-
385
-
386
-
387
-
388
-
389
-
390
-
391
-
392
-
393
-
394
-
395
-
396
-
397
-
398
-
399
-
400
-
401
-
402
-
403
-
404
-
405
-
406
-
407
-
408
-
409
-
410
-
411
-
412
-
413
-
414
-
415
-
416
-
417
-
418
-
419
-
420
-
421
-
422
-
423
-
424
-
425
-
426
-
427
-
428
-
429
-
430
-
431
-
432
-
433
-
434
-
435
-
436
-
437
-
438
-
439
-
440
-
441
-
442
-
443
-
444
-
445
-
446
-
447
-
448
-
449
-
450
-
451
-
452
-
453
-
454
-
455
-
456
-
457
-
458
-
459
-
460
-
461
-
462
-
463
-
464
-
465
-
466
-
467
-
468
-
469
-
470
-
471
-
472
-
473
-
474
-
475
-
476
-
477
-
478
-
479
-
480
-
481
-
482
-
483
-
484
-
485
-
486
-
487
-
488
-
489
-
490
-
491
-
492
-
493
-
494
-
495
-
496
-
497
-
498
-
499
-
500
-
501
-
502
-
503
-
504
-
505
-
506
-
507
-
508
-
509
-
510
-
511
-
512
-
513
-
514
-
515
-
516
-
517
-
518
-
519
-
520
-
521
-
522
-
523
-
524
-
525
-
526
-
527
-
528
-
529
-
530
-
531
-
532
-
533
-
534
-
535
-
536
-
537
-
538
-
539
-
540
-
541
-
542
-
543
-
544
-
545
-
546
-
547
-
548
-
549
-
550
-
551
-
552
-
553
-
554
-
555
-
556
-
557
-
558
-
559
-
560
-
561
-
562
-
563
-
564
 |
 |

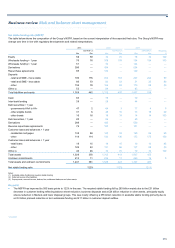
Business review Risk and balance sheet management
220
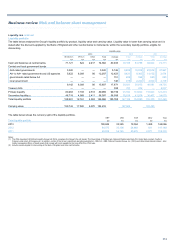
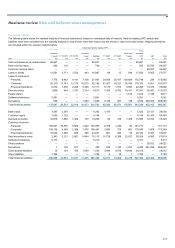
Funding risk continued
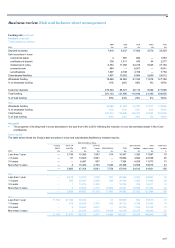
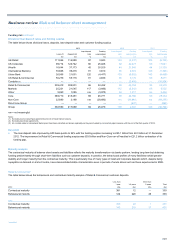
Divisional loan:deposit ratios and funding surplus
The table below shows divisional loans, deposits, loan:deposit ratios and customer funding surplus.
2013 2012 2011
Loan:deposit Funding Loan:deposit Funding Loan:deposit Funding
Loans (1) Deposits (2) ratio surplus/(gap) ratio (gap)/surplus ratio (gap)/surplus
£m £m % £m %£m % £m
UK Retail 111,046 114,889 97 3,843 103 (3,337) 106 (6,105)
UK Corporate 99,714 124,742 80 25,028 82 22,477 86 17,641
Wealth 16,644 37,173 45 20,529 44 21,945 44 21,330
International Banking 35,668 39,278 91 3,610 86 6,672 103 (1,366)
Ulster Bank 26,068 21,651 120 (4,417) 130 (6,683) 143 (9,489)
US Retail & Commercial 50,279 55,118 91 4,839 86 8,178 85 8,871
Conduits (3) — — — — —(2,458) — (10,504)
Retail & Commercial 339,419 392,851 86 53,432 88 46,794 95 20,378
Markets 25,231 21,545 117 (3,686) 112 (3,243) 85 5,522
Other 5,060 1,085 nm (3,975) 64 1,217 nm 2,464
Core 369,710 415,481 89 45,771 90 44,768 93 28,364
Non-Core 22,880 2,188 nm (20,692) nm (41,846) nm (64,235)
Direct Line Group — — —
—
—(881) — (893)
Group 392,590 417,669 94 25,079 100 2,041 108 (36,764)
nm = not meaningful
Notes:
(1) Excludes reverse repurchase agreements and net of impairment provisions.
(2) Excludes repurchase agreements.
(3) All conduits relate to International Banking and have been extracted and shown separately as they were funded by commercial paper issuance until the end of the third quarter of 2012.
Key point
• The loan:deposit ratio improved by 600 basis points to 94% with the funding surplus increasing to £25.1 billion from £2.0 billion at 31 December
2012. The improvement in Retail & Commercial funding surplus was £6.6 billion and Non-Core run-off resulted in £21.2 billion contraction of its
funding gap.
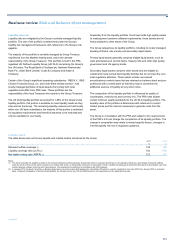
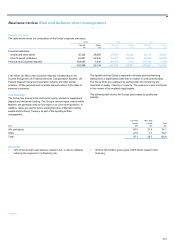
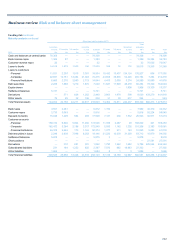
Maturity analysis
The contractual maturity of balance sheet assets and liabilities reflects the maturity transformation role banks perform, lending long-term but obtaining
funding predominantly through short-term liabilities such as customer deposits. In practice, the behavioural profiles of many liabilities exhibit greater
stability and longer maturity than the contractual maturity. This is particularly true of many types of retail and corporate deposits which, despite being
repayable on demand or at short notice, have demonstrated stable characteristics even in periods of acute stress such as those experienced in 2008.
Retail & Commercial*
The table below shows the behavioural and contractual maturity analysis of Retail & Commercial customer deposits.
Less than More than
1 year 1-5 years 5 years Total
2013 £bn £bn £bn £bn
Contractual maturity 381 12 — 393
Behavioural maturity 124 220 49 393
2012
Contractual maturity 380 20 1 401
Behavioural maturity 145 219 37 401
*unaudited