RBS 2013 Annual Report Download - page 325
Download and view the complete annual report
Please find page 325 of the 2013 RBS annual report below. You can navigate through the pages in the report by either clicking on the pages listed below, or by using the keyword search tool below to find specific information within the annual report.-
 1
1 -
2
-
3
-
4
-
5
-
6
-
7
-
8
-
9
-
10
-
11
-
12
-
13
-
14
-
15
-
16
-
17
-
18
-
19
-
20
-
21
-
22
-
23
-
24
-
25
-
26
-
27
-
28
-
29
-
30
-
31
-
32
-
33
-
34
-
35
-
36
-
37
-
38
-
39
-
40
-
41
-
42
-
43
-
44
-
45
-
46
-
47
-
48
-
49
-
50
-
51
-
52
-
53
-
54
-
55
-
56
-
57
-
58
-
59
-
60
-
61
-
62
-
63
-
64
-
65
-
66
-
67
-
68
-
69
-
70
-
71
-
72
-
73
-
74
-
75
-
76
-
77
-
78
-
79
-
80
-
81
-
82
-
83
-
84
-
85
-
86
-
87
-
88
-
89
-
90
-
91
-
92
-
93
-
94
-
95
-
96
-
97
-
98
-
99
-
100
-
101
-
102
-
103
-
104
-
105
-
106
-
107
-
108
-
109
-
110
-
111
-
112
-
113
-
114
-
115
-
116
-
117
-
118
-
119
-
120
-
121
-
122
-
123
-
124
-
125
-
126
-
127
-
128
-
129
-
130
-
131
-
132
-
133
-
134
-
135
-
136
-
137
-
138
-
139
-
140
-
141
-
142
-
143
-
144
-
145
-
146
-
147
-
148
-
149
-
150
-
151
-
152
-
153
-
154
-
155
-
156
-
157
-
158
-
159
-
160
-
161
-
162
-
163
-
164
-
165
-
166
-
167
-
168
-
169
-
170
-
171
-
172
-
173
-
174
-
175
-
176
-
177
-
178
-
179
-
180
-
181
-
182
-
183
-
184
-
185
-
186
-
187
-
188
-
189
-
190
-
191
-
192
-
193
-
194
-
195
-
196
-
197
-
198
-
199
-
200
-
201
-
202
-
203
-
204
-
205
-
206
-
207
-
208
-
209
-
210
-
211
-
212
-
213
-
214
-
215
-
216
-
217
-
218
-
219
-
220
-
221
-
222
-
223
-
224
-
225
-
226
-
227
-
228
-
229
-
230
-
231
-
232
-
233
-
234
-
235
-
236
-
237
-
238
-
239
-
240
-
241
-
242
-
243
-
244
-
245
-
246
-
247
-
248
-
249
-
250
-
251
-
252
-
253
-
254
-
255
-
256
-
257
-
258
-
259
-
260
-
261
-
262
-
263
-
264
-
265
-
266
-
267
-
268
-
269
-
270
-
271
-
272
-
273
-
274
-
275
-
276
-
277
-
278
-
279
-
280
-
281
-
282
-
283
-
284
-
285
-
286
-
287
-
288
-
289
-
290
-
291
-
292
-
293
-
294
-
295
-
296
-
297
-
298
-
299
-
300
-
301
-
302
-
303
-
304
-
305
-
306
-
307
-
308
-
309
-
310
-
311
-
312
-
313
-
314
-
 315
315 -
 316
316 -
 317
317 -
 318
318 -
 319
319 -
 320
320 -
 321
321 -
 322
322 -
 323
323 -
 324
324 -
 325
325 -
 326
326 -
 327
327 -
 328
328 -
 329
329 -
 330
330 -
 331
331 -
 332
332 -
 333
333 -
 334
334 -
 335
335 -
336
-
337
-
338
-
339
-
340
-
341
-
342
-
343
-
344
-
345
-
346
-
347
-
348
-
349
-
350
-
351
-
352
-
353
-
354
-
355
-
356
-
357
-
358
-
359
-
360
-
361
-
362
-
363
-
364
-
365
-
366
-
367
-
368
-
369
-
370
-
371
-
372
-
373
-
374
-
375
-
376
-
377
-
378
-
379
-
380
-
381
-
382
-
383
-
384
-
385
-
386
-
387
-
388
-
389
-
390
-
391
-
392
-
393
-
394
-
395
-
396
-
397
-
398
-
399
-
400
-
401
-
402
-
403
-
404
-
405
-
406
-
407
-
408
-
409
-
410
-
411
-
412
-
413
-
414
-
415
-
416
-
417
-
418
-
419
-
420
-
421
-
422
-
423
-
424
-
425
-
426
-
427
-
428
-
429
-
430
-
431
-
432
-
433
-
434
-
435
-
436
-
437
-
438
-
439
-
440
-
441
-
442
-
443
-
444
-
445
-
446
-
447
-
448
-
449
-
450
-
451
-
452
-
453
-
454
-
455
-
456
-
457
-
458
-
459
-
460
-
461
-
462
-
463
-
464
-
465
-
466
-
467
-
468
-
469
-
470
-
471
-
472
-
473
-
474
-
475
-
476
-
477
-
478
-
479
-
480
-
481
-
482
-
483
-
484
-
485
-
486
-
487
-
488
-
489
-
490
-
491
-
492
-
493
-
494
-
495
-
496
-
497
-
498
-
499
-
500
-
501
-
502
-
503
-
504
-
505
-
506
-
507
-
508
-
509
-
510
-
511
-
512
-
513
-
514
-
515
-
516
-
517
-
518
-
519
-
520
-
521
-
522
-
523
-
524
-
525
-
526
-
527
-
528
-
529
-
530
-
531
-
532
-
533
-
534
-
535
-
536
-
537
-
538
-
539
-
540
-
541
-
542
-
543
-
544
-
545
-
546
-
547
-
548
-
549
-
550
-
551
-
552
-
553
-
554
-
555
-
556
-
557
-
558
-
559
-
560
-
561
-
562
-
563
-
564
 |
 |

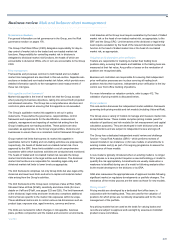
Business review Risk and balance sheet management
323
Mitigation
To ensure approved limits are not breached and that the Group remains
within its risk appetite, triggers at Group, legal entity and divisional levels
have been set such that if exposures exceed a specified level, action
plans are developed by the front office, Market Risk and Finance.
Counterparty Exposure Management
Management of the over-the-counter derivative counterparty credit risk
and funding risk is carried out by the Counterparty Exposure
Management (CEM) desk in Markets. CEM actively manages risk
exposures and concentrations on behalf of both Markets and Non-Core.
The hedging transactions CEM enters into are booked in the trading book
and therefore contribute to the Group’s market risk VaR exposure and
capital.
Risk measurement
The Group uses a comprehensive and complementary set of
methodologies and techniques to measure traded market risk that
collectively ensure a complete approach to the measurement of material
market risks.
The Group's main measurement
methods are VaR and SVaR.
Risks that are not adequately
captured by these model
methodologies are captured by the
Risks Not in VaR (RNIV)
framework to ensure that the
Group is adequately capitalised for
market risk. In addition, stress
testing is used to identify any
vulnerabilities and potential losses
in excess of VaR and SVaR.
These methods have been designed to capture correlation effects and
allow the Group to form an aggregated view of its traded market risk
across risk types, markets and business lines while also taking into
account the characteristics of each risk type.
Each of these methodologies and techniques is discussed in more detail
below.
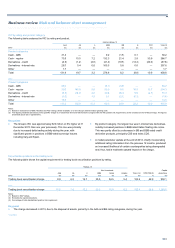
Value at-risk
VaR is a statistical estimate of the potential change in the market value of
a portfolio (and, thus, the impact on the income statement) over a
specified time horizon at a given confidence level.
For internal risk management purposes, the Group’s VaR assumes a
time horizon of one trading day and a confidence level of 99%. The
Group's VaR model is based on a historical simulation, utilising data from
the previous 500 days on an equally weighted basis.
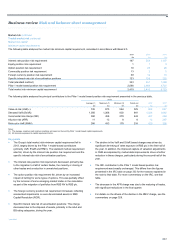
The Group’s internal traded VaR model captures all trading book
positions including those approved by the regulator. In 2013,
improvements were made to the risk sensitivities associated with funding
valuation adjustments (FVAs), which resulted in a reduction in the hedge
portfolio. At the point of implementation, the impact on RBS plc was a £9
million decrease in 1-day 99% regulatory VaR and an associated £42
million decrease in regulatory SVaR. The current internal VaR
methodology does not include credit valuation adjustment (CVA) and
FVA exposures as these are out of scope of the measure, although the
Group is planning to include these in its internal VaR measure in 2014.
For an explanation of the distinction between internal VaR and regulatory
VaR, see page 330.
The RBS internal VaR model captures the impact on the income
statement of the following risk factors:
• Interest rate risk, which arises from the impact of changes in interest
rates and volatilities on cash instruments and derivatives. This
includes interest rate tenor basis risk and cross-currency basis risk.
• Credit spread risk, which arises from the impact of changes in the
credit spreads of sovereign bonds, corporate bonds, securitised
products and credit derivatives.
• Currency risk, which arises from the impact of changes in currency
rates and volatilities.
• Equity risk, which arises from the impact of changes in equity prices,
volatilities and dividend yields.
• Commodity risk, which arises from the impact of changes in
commodity prices and volatilities.
The risk factors presented above are sufficient to define the Group’s
overall market risk exposures. In addition, the following risks, which are
components of the above-mentioned risk factors, are also monitored by
individual businesses to identify and address any material concentrations:
• Basis risk, which is the risk that imperfect correlation between two
instruments in a hedging strategy creates the potential for excess
gains or losses, thus adding risk to the position;
• Prepayment risk, which is the risk associated with early unscheduled
return of principal on a fixed rate security; and
• Inflation risk, which is the risk of a decrease in the value of
instruments as a result of changes in inflation rates and associated
volatilities.