RBS 2013 Annual Report Download - page 330
Download and view the complete annual report
Please find page 330 of the 2013 RBS annual report below. You can navigate through the pages in the report by either clicking on the pages listed below, or by using the keyword search tool below to find specific information within the annual report.-
 1
1 -
2
-
3
-
4
-
5
-
6
-
7
-
8
-
9
-
10
-
11
-
12
-
13
-
14
-
15
-
16
-
17
-
18
-
19
-
20
-
21
-
22
-
23
-
24
-
25
-
26
-
27
-
28
-
29
-
30
-
31
-
32
-
33
-
34
-
35
-
36
-
37
-
38
-
39
-
40
-
41
-
42
-
43
-
44
-
45
-
46
-
47
-
48
-
49
-
50
-
51
-
52
-
53
-
54
-
55
-
56
-
57
-
58
-
59
-
60
-
61
-
62
-
63
-
64
-
65
-
66
-
67
-
68
-
69
-
70
-
71
-
72
-
73
-
74
-
75
-
76
-
77
-
78
-
79
-
80
-
81
-
82
-
83
-
84
-
85
-
86
-
87
-
88
-
89
-
90
-
91
-
92
-
93
-
94
-
95
-
96
-
97
-
98
-
99
-
100
-
101
-
102
-
103
-
104
-
105
-
106
-
107
-
108
-
109
-
110
-
111
-
112
-
113
-
114
-
115
-
116
-
117
-
118
-
119
-
120
-
121
-
122
-
123
-
124
-
125
-
126
-
127
-
128
-
129
-
130
-
131
-
132
-
133
-
134
-
135
-
136
-
137
-
138
-
139
-
140
-
141
-
142
-
143
-
144
-
145
-
146
-
147
-
148
-
149
-
150
-
151
-
152
-
153
-
154
-
155
-
156
-
157
-
158
-
159
-
160
-
161
-
162
-
163
-
164
-
165
-
166
-
167
-
168
-
169
-
170
-
171
-
172
-
173
-
174
-
175
-
176
-
177
-
178
-
179
-
180
-
181
-
182
-
183
-
184
-
185
-
186
-
187
-
188
-
189
-
190
-
191
-
192
-
193
-
194
-
195
-
196
-
197
-
198
-
199
-
200
-
201
-
202
-
203
-
204
-
205
-
206
-
207
-
208
-
209
-
210
-
211
-
212
-
213
-
214
-
215
-
216
-
217
-
218
-
219
-
220
-
221
-
222
-
223
-
224
-
225
-
226
-
227
-
228
-
229
-
230
-
231
-
232
-
233
-
234
-
235
-
236
-
237
-
238
-
239
-
240
-
241
-
242
-
243
-
244
-
245
-
246
-
247
-
248
-
249
-
250
-
251
-
252
-
253
-
254
-
255
-
256
-
257
-
258
-
259
-
260
-
261
-
262
-
263
-
264
-
265
-
266
-
267
-
268
-
269
-
270
-
271
-
272
-
273
-
274
-
275
-
276
-
277
-
278
-
279
-
280
-
281
-
282
-
283
-
284
-
285
-
286
-
287
-
288
-
289
-
290
-
291
-
292
-
293
-
294
-
295
-
296
-
297
-
298
-
299
-
300
-
301
-
302
-
303
-
304
-
305
-
306
-
307
-
308
-
309
-
310
-
311
-
312
-
313
-
314
-
315
-
316
-
317
-
318
-
319
-
 320
320 -
 321
321 -
 322
322 -
 323
323 -
 324
324 -
 325
325 -
 326
326 -
 327
327 -
 328
328 -
 329
329 -
 330
330 -
 331
331 -
 332
332 -
 333
333 -
 334
334 -
 335
335 -
 336
336 -
 337
337 -
 338
338 -
 339
339 -
 340
340 -
341
-
342
-
343
-
344
-
345
-
346
-
347
-
348
-
349
-
350
-
351
-
352
-
353
-
354
-
355
-
356
-
357
-
358
-
359
-
360
-
361
-
362
-
363
-
364
-
365
-
366
-
367
-
368
-
369
-
370
-
371
-
372
-
373
-
374
-
375
-
376
-
377
-
378
-
379
-
380
-
381
-
382
-
383
-
384
-
385
-
386
-
387
-
388
-
389
-
390
-
391
-
392
-
393
-
394
-
395
-
396
-
397
-
398
-
399
-
400
-
401
-
402
-
403
-
404
-
405
-
406
-
407
-
408
-
409
-
410
-
411
-
412
-
413
-
414
-
415
-
416
-
417
-
418
-
419
-
420
-
421
-
422
-
423
-
424
-
425
-
426
-
427
-
428
-
429
-
430
-
431
-
432
-
433
-
434
-
435
-
436
-
437
-
438
-
439
-
440
-
441
-
442
-
443
-
444
-
445
-
446
-
447
-
448
-
449
-
450
-
451
-
452
-
453
-
454
-
455
-
456
-
457
-
458
-
459
-
460
-
461
-
462
-
463
-
464
-
465
-
466
-
467
-
468
-
469
-
470
-
471
-
472
-
473
-
474
-
475
-
476
-
477
-
478
-
479
-
480
-
481
-
482
-
483
-
484
-
485
-
486
-
487
-
488
-
489
-
490
-
491
-
492
-
493
-
494
-
495
-
496
-
497
-
498
-
499
-
500
-
501
-
502
-
503
-
504
-
505
-
506
-
507
-
508
-
509
-
510
-
511
-
512
-
513
-
514
-
515
-
516
-
517
-
518
-
519
-
520
-
521
-
522
-
523
-
524
-
525
-
526
-
527
-
528
-
529
-
530
-
531
-
532
-
533
-
534
-
535
-
536
-
537
-
538
-
539
-
540
-
541
-
542
-
543
-
544
-
545
-
546
-
547
-
548
-
549
-
550
-
551
-
552
-
553
-
554
-
555
-
556
-
557
-
558
-
559
-
560
-
561
-
562
-
563
-
564
 |
 |

Business review Risk and balance sheet management
328
Market risk continued
Traded market risk continued
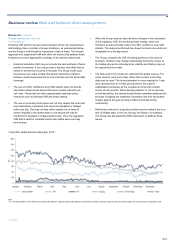
Stressed VaR (SVaR)*
As with VaR, the SVaR technique produces estimates of the potential
change in the market value of a portfolio, over a specified time horizon, at
a given confidence level. SVaR is a VaR-based measure using historical
data from a one-year period of stressed market conditions.
The risk system simulates 99% VaR on the current portfolio for each 260-
day period from 1 January 2005 to the current VaR date, moving forward
one day at a time. The SVaR is the worst VaR outcome of the simulated
results.
This is in contrast with VaR, which is based on a rolling 500-day historical
data set. For the purposes of both internal risk management and
regulatory SVaR calculation, a time horizon of ten trading days is
assumed with a confidence level of 99%.
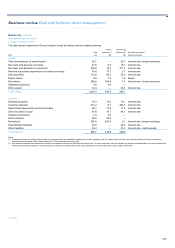
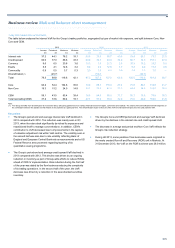
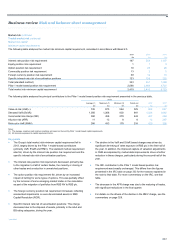
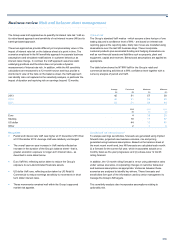
Trading SVaR*
2013 2012
£m £m
Total Group 309 396
Core Markets 298 372
Non-Core 51 69
Key point
• The Group's period end SVaR declined in 2013 compared with
2012. This is consistent with the observed decrease in VaR during
2013 and is primarily driven by significant de-risking of interest rate
exposures and reduction in the asset-backed securities inventory.
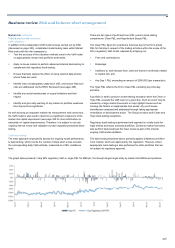
Risks not in VaR (RNIVs)*
The RNIV approach is used for market risks that fall within the scope of
VaR and SVaR but that are insufficiently captured by the model
methodology, for example due to a lack of suitable historical data. The
RNIV framework has been developed to quantify these market risks and
to ensure that the Group holds adequate capital.
The need for an RNIV is typically identified in one of the following two
circumstances: (i) as part of the New Product Risk Assessment process,
when a risk manager assesses that the associated risk is not adequately
captured by the VaR model; or (ii) as a result of a recommendation made
by GRA or the model validation team when reviewing the VaR model.
The RNIVs provide a capital estimate of risks not captured in the VaR
model and are regularly reported and discussed with senior management
and the regulator. The methodology used in the RNIV calculation is
internally reviewed by the model-testing team. Where appropriate, risk
managers set sensitivity limits to control specific risk factors giving rise to
the RNIV. RNIVs form an integral part of the Group’s ongoing model and
data improvement efforts to capture all market risks in scope for model
approval in VaR and SVaR. Since the introduction of the RNIV
framework, the Group has made significant progress in transitioning
RNIVs into the VaR model.
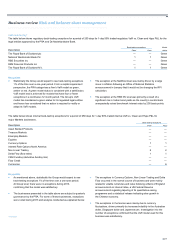
The Group adopts two approaches for the quantification of RNIVs:
• A standalone VaR approach. Under this approach, two values are
calculated: (i) the VaR RNIV; and (ii) the SVaR RNIV.
• A stress-scenario approach. Under this approach, an assessment of
ten-day extreme, but plausible, market moves is used in
combination with position sensitivities to give a stress-type loss
number - the stressed RNIV value.
In 2013, for each legal entity covered by the PRA VaR model waiver,
RNIVs above a regulatory defined threshold were aggregated to obtain
the following three measures: (i) Total VaR RNIV; (ii) Total SVaR RNIV;
and (iii) Total stressed RNIV. In each of these categories, potential
diversification benefits between RNIVs are ignored.
The top ten RNIVs represent approximately two thirds of the total RNIV
capital requirement.
RNIVs are broadly classified as follows:
• Proxied sensitivities or risk factors: to cover instruments for which
market data is not available.
• Higher-order sensitivity terms: to account for the fact that the
Group’s VaR model is based on a P&L approximation function rather
than full repricing of deals.
• Interpolation and re-bucketing inaccuracy: to cover residual errors
resulting from the pre-processing of risk factors into a standard set
across tenors.
• Data selection bias: to cover the possibility of suboptimal data
sources being selected for risk factors.
• Static pricing parameters: to cover the possibility that suboptimal
assumed values are used for certain unobserved parameters
in pricing models.
• Missing basis risks: to cover cases where data sources are not
detailed enough to differentiate the risks of long and short pairs of
closely related instruments.
The most material of these are proxy or basis risks, followed by higher-
order sensitivity risks.
RNIVs that are related specifically to instruments that have level 3
valuation hierarchy assumptions (see pages 418 to 423) are mainly
included in the following categories: proxied sensitivities or risk factors;
higher-order sensitivity terms; and static pricing parameters.
*unaudited