RBS 2013 Annual Report Download - page 494
Download and view the complete annual report
Please find page 494 of the 2013 RBS annual report below. You can navigate through the pages in the report by either clicking on the pages listed below, or by using the keyword search tool below to find specific information within the annual report.-
 1
1 -
2
-
3
-
4
-
5
-
6
-
7
-
8
-
9
-
10
-
11
-
12
-
13
-
14
-
15
-
16
-
17
-
18
-
19
-
20
-
21
-
22
-
23
-
24
-
25
-
26
-
27
-
28
-
29
-
30
-
31
-
32
-
33
-
34
-
35
-
36
-
37
-
38
-
39
-
40
-
41
-
42
-
43
-
44
-
45
-
46
-
47
-
48
-
49
-
50
-
51
-
52
-
53
-
54
-
55
-
56
-
57
-
58
-
59
-
60
-
61
-
62
-
63
-
64
-
65
-
66
-
67
-
68
-
69
-
70
-
71
-
72
-
73
-
74
-
75
-
76
-
77
-
78
-
79
-
80
-
81
-
82
-
83
-
84
-
85
-
86
-
87
-
88
-
89
-
90
-
91
-
92
-
93
-
94
-
95
-
96
-
97
-
98
-
99
-
100
-
101
-
102
-
103
-
104
-
105
-
106
-
107
-
108
-
109
-
110
-
111
-
112
-
113
-
114
-
115
-
116
-
117
-
118
-
119
-
120
-
121
-
122
-
123
-
124
-
125
-
126
-
127
-
128
-
129
-
130
-
131
-
132
-
133
-
134
-
135
-
136
-
137
-
138
-
139
-
140
-
141
-
142
-
143
-
144
-
145
-
146
-
147
-
148
-
149
-
150
-
151
-
152
-
153
-
154
-
155
-
156
-
157
-
158
-
159
-
160
-
161
-
162
-
163
-
164
-
165
-
166
-
167
-
168
-
169
-
170
-
171
-
172
-
173
-
174
-
175
-
176
-
177
-
178
-
179
-
180
-
181
-
182
-
183
-
184
-
185
-
186
-
187
-
188
-
189
-
190
-
191
-
192
-
193
-
194
-
195
-
196
-
197
-
198
-
199
-
200
-
201
-
202
-
203
-
204
-
205
-
206
-
207
-
208
-
209
-
210
-
211
-
212
-
213
-
214
-
215
-
216
-
217
-
218
-
219
-
220
-
221
-
222
-
223
-
224
-
225
-
226
-
227
-
228
-
229
-
230
-
231
-
232
-
233
-
234
-
235
-
236
-
237
-
238
-
239
-
240
-
241
-
242
-
243
-
244
-
245
-
246
-
247
-
248
-
249
-
250
-
251
-
252
-
253
-
254
-
255
-
256
-
257
-
258
-
259
-
260
-
261
-
262
-
263
-
264
-
265
-
266
-
267
-
268
-
269
-
270
-
271
-
272
-
273
-
274
-
275
-
276
-
277
-
278
-
279
-
280
-
281
-
282
-
283
-
284
-
285
-
286
-
287
-
288
-
289
-
290
-
291
-
292
-
293
-
294
-
295
-
296
-
297
-
298
-
299
-
300
-
301
-
302
-
303
-
304
-
305
-
306
-
307
-
308
-
309
-
310
-
311
-
312
-
313
-
314
-
315
-
316
-
317
-
318
-
319
-
320
-
321
-
322
-
323
-
324
-
325
-
326
-
327
-
328
-
329
-
330
-
331
-
332
-
333
-
334
-
335
-
336
-
337
-
338
-
339
-
340
-
341
-
342
-
343
-
344
-
345
-
346
-
347
-
348
-
349
-
350
-
351
-
352
-
353
-
354
-
355
-
356
-
357
-
358
-
359
-
360
-
361
-
362
-
363
-
364
-
365
-
366
-
367
-
368
-
369
-
370
-
371
-
372
-
373
-
374
-
375
-
376
-
377
-
378
-
379
-
380
-
381
-
382
-
383
-
384
-
385
-
386
-
387
-
388
-
389
-
390
-
391
-
392
-
393
-
394
-
395
-
396
-
397
-
398
-
399
-
400
-
401
-
402
-
403
-
404
-
405
-
406
-
407
-
408
-
409
-
410
-
411
-
412
-
413
-
414
-
415
-
416
-
417
-
418
-
419
-
420
-
421
-
422
-
423
-
424
-
425
-
426
-
427
-
428
-
429
-
430
-
431
-
432
-
433
-
434
-
435
-
436
-
437
-
438
-
439
-
440
-
441
-
442
-
443
-
444
-
445
-
446
-
447
-
448
-
449
-
450
-
451
-
452
-
453
-
454
-
455
-
456
-
457
-
458
-
459
-
460
-
461
-
462
-
463
-
464
-
465
-
466
-
467
-
468
-
469
-
470
-
471
-
472
-
473
-
474
-
475
-
476
-
477
-
478
-
479
-
480
-
481
-
482
-
483
-
 484
484 -
 485
485 -
 486
486 -
 487
487 -
 488
488 -
 489
489 -
 490
490 -
 491
491 -
 492
492 -
 493
493 -
 494
494 -
 495
495 -
 496
496 -
 497
497 -
 498
498 -
 499
499 -
 500
500 -
 501
501 -
 502
502 -
 503
503 -
 504
504 -
505
-
506
-
507
-
508
-
509
-
510
-
511
-
512
-
513
-
514
-
515
-
516
-
517
-
518
-
519
-
520
-
521
-
522
-
523
-
524
-
525
-
526
-
527
-
528
-
529
-
530
-
531
-
532
-
533
-
534
-
535
-
536
-
537
-
538
-
539
-
540
-
541
-
542
-
543
-
544
-
545
-
546
-
547
-
548
-
549
-
550
-
551
-
552
-
553
-
554
-
555
-
556
-
557
-
558
-
559
-
560
-
561
-
562
-
563
-
564
 |
 |

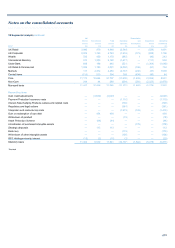
Notes on the consolidated accounts
492
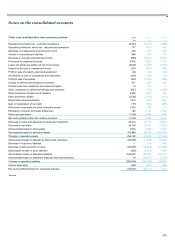
38 Segmental analysis continued
Segmental analysis of assets and liabilities included in disposal groups:
2013 2012 2011
Assets Liabilities Assets Liabilities Assets Liabilities
£m £m £m £m £m £m
UK Retail — — — — 7,048 8,808
UK Corporate — — — — 11,727 12,977
Wealth 3 — — — — —
International Banking 4 47 144 51 414 88
US Retail & Commercial 679 3,190 — — — —
Markets 74 1 91 2 17 29
Central items 882 1 (74) 1 136 2
Non-Core 773 21 576 808 5,670 1,779
Direct Line Group — — 12,697 9,267 — —
RFS Holdings minority interest 602 118 579 41 438 312
3,017 3,378 14,013 10,170 25,450 23,995
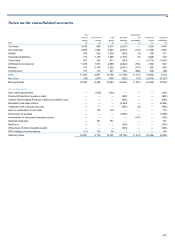
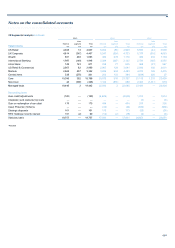
Segmental analysis of goodwill is as follows:
UK U
K
International US Retail & Direct Line
Retail Corporate Wealth Banking Commercial Markets Non-Core Group Total
£m £m £m £m £m £m £m £m £m
A
t 1 January 2011 2,799 2,882 812 1,092 3,980 2 15 946 12,528
Transfer to disposal groups — — — — — — (15) — (15)
Currency translation and other adjustments — — — (28) 12 1 — (1) (16)
A
cquisitions — — — — — 18 — — 18
Write-down of goodwill
- continuing operations (20) (60) — — — — — — (80)
- discontinued operations — — — — — — — (11) (11)
A
t 1 January 2012 2,779 2,822 812 1,064 3,992 21 — 934 12,424
Transfers to disposal groups — — — — — — — (540) (540)
Disposals — — (9) — — — — — (9)
Currency translation and other adjustments — — (3) (24) (169) (1) — — (197)
Write-down of goodwill
- continuing operations — — — — — (18) — — (18)
- discontinued operations — — — — — — — (394) (394)
A
t 1 January 2013 2,779 2,822 800 1,040 3,823 2 — — 11,266
Disposals — — (1) — — — — — (1)
Currency translation and other adjustments — — 2 19 (88) — — — (67)
Write-down of goodwill — — — (1,059) — — — — (1,059)
A
t 31 December 2013 2,779 2,822 801 —3,735 2 — — 10,139