RBS 2013 Annual Report Download - page 243
Download and view the complete annual report
Please find page 243 of the 2013 RBS annual report below. You can navigate through the pages in the report by either clicking on the pages listed below, or by using the keyword search tool below to find specific information within the annual report.-
 1
1 -
2
-
3
-
4
-
5
-
6
-
7
-
8
-
9
-
10
-
11
-
12
-
13
-
14
-
15
-
16
-
17
-
18
-
19
-
20
-
21
-
22
-
23
-
24
-
25
-
26
-
27
-
28
-
29
-
30
-
31
-
32
-
33
-
34
-
35
-
36
-
37
-
38
-
39
-
40
-
41
-
42
-
43
-
44
-
45
-
46
-
47
-
48
-
49
-
50
-
51
-
52
-
53
-
54
-
55
-
56
-
57
-
58
-
59
-
60
-
61
-
62
-
63
-
64
-
65
-
66
-
67
-
68
-
69
-
70
-
71
-
72
-
73
-
74
-
75
-
76
-
77
-
78
-
79
-
80
-
81
-
82
-
83
-
84
-
85
-
86
-
87
-
88
-
89
-
90
-
91
-
92
-
93
-
94
-
95
-
96
-
97
-
98
-
99
-
100
-
101
-
102
-
103
-
104
-
105
-
106
-
107
-
108
-
109
-
110
-
111
-
112
-
113
-
114
-
115
-
116
-
117
-
118
-
119
-
120
-
121
-
122
-
123
-
124
-
125
-
126
-
127
-
128
-
129
-
130
-
131
-
132
-
133
-
134
-
135
-
136
-
137
-
138
-
139
-
140
-
141
-
142
-
143
-
144
-
145
-
146
-
147
-
148
-
149
-
150
-
151
-
152
-
153
-
154
-
155
-
156
-
157
-
158
-
159
-
160
-
161
-
162
-
163
-
164
-
165
-
166
-
167
-
168
-
169
-
170
-
171
-
172
-
173
-
174
-
175
-
176
-
177
-
178
-
179
-
180
-
181
-
182
-
183
-
184
-
185
-
186
-
187
-
188
-
189
-
190
-
191
-
192
-
193
-
194
-
195
-
196
-
197
-
198
-
199
-
200
-
201
-
202
-
203
-
204
-
205
-
206
-
207
-
208
-
209
-
210
-
211
-
212
-
213
-
214
-
215
-
216
-
217
-
218
-
219
-
220
-
221
-
222
-
223
-
224
-
225
-
226
-
227
-
228
-
229
-
230
-
231
-
232
-
 233
233 -
 234
234 -
 235
235 -
 236
236 -
 237
237 -
 238
238 -
 239
239 -
 240
240 -
 241
241 -
 242
242 -
 243
243 -
 244
244 -
 245
245 -
 246
246 -
 247
247 -
 248
248 -
 249
249 -
 250
250 -
 251
251 -
 252
252 -
 253
253 -
254
-
255
-
256
-
257
-
258
-
259
-
260
-
261
-
262
-
263
-
264
-
265
-
266
-
267
-
268
-
269
-
270
-
271
-
272
-
273
-
274
-
275
-
276
-
277
-
278
-
279
-
280
-
281
-
282
-
283
-
284
-
285
-
286
-
287
-
288
-
289
-
290
-
291
-
292
-
293
-
294
-
295
-
296
-
297
-
298
-
299
-
300
-
301
-
302
-
303
-
304
-
305
-
306
-
307
-
308
-
309
-
310
-
311
-
312
-
313
-
314
-
315
-
316
-
317
-
318
-
319
-
320
-
321
-
322
-
323
-
324
-
325
-
326
-
327
-
328
-
329
-
330
-
331
-
332
-
333
-
334
-
335
-
336
-
337
-
338
-
339
-
340
-
341
-
342
-
343
-
344
-
345
-
346
-
347
-
348
-
349
-
350
-
351
-
352
-
353
-
354
-
355
-
356
-
357
-
358
-
359
-
360
-
361
-
362
-
363
-
364
-
365
-
366
-
367
-
368
-
369
-
370
-
371
-
372
-
373
-
374
-
375
-
376
-
377
-
378
-
379
-
380
-
381
-
382
-
383
-
384
-
385
-
386
-
387
-
388
-
389
-
390
-
391
-
392
-
393
-
394
-
395
-
396
-
397
-
398
-
399
-
400
-
401
-
402
-
403
-
404
-
405
-
406
-
407
-
408
-
409
-
410
-
411
-
412
-
413
-
414
-
415
-
416
-
417
-
418
-
419
-
420
-
421
-
422
-
423
-
424
-
425
-
426
-
427
-
428
-
429
-
430
-
431
-
432
-
433
-
434
-
435
-
436
-
437
-
438
-
439
-
440
-
441
-
442
-
443
-
444
-
445
-
446
-
447
-
448
-
449
-
450
-
451
-
452
-
453
-
454
-
455
-
456
-
457
-
458
-
459
-
460
-
461
-
462
-
463
-
464
-
465
-
466
-
467
-
468
-
469
-
470
-
471
-
472
-
473
-
474
-
475
-
476
-
477
-
478
-
479
-
480
-
481
-
482
-
483
-
484
-
485
-
486
-
487
-
488
-
489
-
490
-
491
-
492
-
493
-
494
-
495
-
496
-
497
-
498
-
499
-
500
-
501
-
502
-
503
-
504
-
505
-
506
-
507
-
508
-
509
-
510
-
511
-
512
-
513
-
514
-
515
-
516
-
517
-
518
-
519
-
520
-
521
-
522
-
523
-
524
-
525
-
526
-
527
-
528
-
529
-
530
-
531
-
532
-
533
-
534
-
535
-
536
-
537
-
538
-
539
-
540
-
541
-
542
-
543
-
544
-
545
-
546
-
547
-
548
-
549
-
550
-
551
-
552
-
553
-
554
-
555
-
556
-
557
-
558
-
559
-
560
-
561
-
562
-
563
-
564
 |
 |

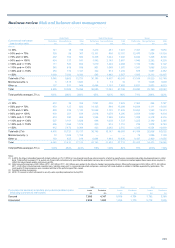
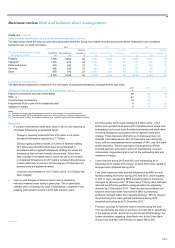
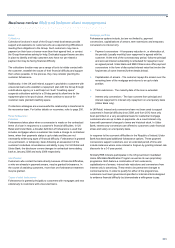
Business review Risk and balance sheet management
241
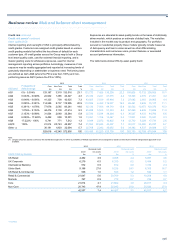
UK Retail Ulster Bank RBS Citizens (1)
Non- Non- Non-
Performing performing Total Performing performing Total Performing performing Total
Loan-to-value ratio £m £m £m £m £m £m £m £m £m
2011
<= 50% 21,537 285 21,822 2,568 222 2,790 4,745 49 4,794
> 50% and <= 70% 25,598 390 25,988 1,877 157 2,034 4,713 78 4,791
> 70% and <= 90% 33,738 671 34,409 2,280 223 2,503 6,893 125 7,018
> 90% and <= 100% 7,365 343 7,708 1,377 128 1,505 2,352 66 2,418
> 100% and <= 110% 3,817 276 4,093 1,462 130 1,592 1,517 53 1,570
> 110% and <= 130% 1,514 199 1,713 2,752 322 3,074 1,536 53 1,589
> 130% and <= 150% 60 15 75 2,607 369 2,976 626 28 654
> 150% — — — 2,798 748 3,546 588 27 615
Total with LTVs 93,629 2,179 95,808 17,721 2,299 20,020 22,970 479 23,449
Other (2) 567 13 580 — — — 681 23 704
Total 94,196 2,192 96,388 17,721 2,299 20,020 23,651 502 24,153
Total portfolio average LTV (3) 67% 80% 67% 104% 125% 106% 76% 91% 77%
A
verage LTV on new originations during the year (3) 63% 74% 63%
Notes:
(1) Includes residential mortgages and home equity loans and lines (refer to page 260 for a breakdown of balances).
(2) Where no indexed LTV is held.
(3) Average LTV weighted by value is calculated using the LTV on each individual mortgage and applying a weighting based on the value of each mortgage.
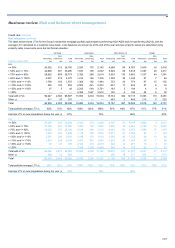
Counterparty credit risk
The Group mitigates counterparty credit risk arising from both derivatives
and repurchase agreements through the use of netting, collateral and the
use of market standard documentation.
The Group mitigates counterparty credit risk by netting amounts it owes
to a counterparty against amounts the same counterparty owes to it, in
accordance with relevant regulatory and internal policies. It generally
does so only if it has a netting agreement in place as well as a legal
opinion to the effect that the agreement is enforceable in the relevant
jurisdictions.
Collateral generally takes the form of cash. In the case of repurchase
agreements, collateral usually takes the form of debt and equity securities
at the outset but if the value of collateral falls relative to that of the
obligation, the Group may require additional collateral in the form of cash
(variation margin). Industry standard documentation, such as master
repurchase agreements and credit support annexes accompanied by
legal opinion, is used for financial collateral taken as part of trading
activities.
The Group limits counterparty credit exposures by setting limits which
take into account the potential adverse movement of a counterparty credit
exposure after adjusting the impact of netting and collateral where
applicable.
2013 2012 2011
Mitigation of counterparty credit risk £bn £bn £bn
Reverse repurchase agreements 76.5 104.8 100.9
Securities received as collateral (1) (76.4) (104.7) (98.9)
Derivative assets gross exposure 288.0 441.9 530.1
Counterparty netting (242.8) (373.9) (441.6)
Cash collateral held (24.3) (34.1) (37.2)
Securities received as collateral (6.0) (5.6) (5.3)
Note:
(1) In accordance with normal market practice, at 31 December 2013 £63.7 billion (2012 - £100.7 billion; 2011 - £95.4 billion) had been resold or re-pledged as collateral for the Group's own
transactions.