RBS 2013 Annual Report Download - page 262
Download and view the complete annual report
Please find page 262 of the 2013 RBS annual report below. You can navigate through the pages in the report by either clicking on the pages listed below, or by using the keyword search tool below to find specific information within the annual report.-
 1
1 -
2
-
3
-
4
-
5
-
6
-
7
-
8
-
9
-
10
-
11
-
12
-
13
-
14
-
15
-
16
-
17
-
18
-
19
-
20
-
21
-
22
-
23
-
24
-
25
-
26
-
27
-
28
-
29
-
30
-
31
-
32
-
33
-
34
-
35
-
36
-
37
-
38
-
39
-
40
-
41
-
42
-
43
-
44
-
45
-
46
-
47
-
48
-
49
-
50
-
51
-
52
-
53
-
54
-
55
-
56
-
57
-
58
-
59
-
60
-
61
-
62
-
63
-
64
-
65
-
66
-
67
-
68
-
69
-
70
-
71
-
72
-
73
-
74
-
75
-
76
-
77
-
78
-
79
-
80
-
81
-
82
-
83
-
84
-
85
-
86
-
87
-
88
-
89
-
90
-
91
-
92
-
93
-
94
-
95
-
96
-
97
-
98
-
99
-
100
-
101
-
102
-
103
-
104
-
105
-
106
-
107
-
108
-
109
-
110
-
111
-
112
-
113
-
114
-
115
-
116
-
117
-
118
-
119
-
120
-
121
-
122
-
123
-
124
-
125
-
126
-
127
-
128
-
129
-
130
-
131
-
132
-
133
-
134
-
135
-
136
-
137
-
138
-
139
-
140
-
141
-
142
-
143
-
144
-
145
-
146
-
147
-
148
-
149
-
150
-
151
-
152
-
153
-
154
-
155
-
156
-
157
-
158
-
159
-
160
-
161
-
162
-
163
-
164
-
165
-
166
-
167
-
168
-
169
-
170
-
171
-
172
-
173
-
174
-
175
-
176
-
177
-
178
-
179
-
180
-
181
-
182
-
183
-
184
-
185
-
186
-
187
-
188
-
189
-
190
-
191
-
192
-
193
-
194
-
195
-
196
-
197
-
198
-
199
-
200
-
201
-
202
-
203
-
204
-
205
-
206
-
207
-
208
-
209
-
210
-
211
-
212
-
213
-
214
-
215
-
216
-
217
-
218
-
219
-
220
-
221
-
222
-
223
-
224
-
225
-
226
-
227
-
228
-
229
-
230
-
231
-
232
-
233
-
234
-
235
-
236
-
237
-
238
-
239
-
240
-
241
-
242
-
243
-
244
-
245
-
246
-
247
-
248
-
249
-
250
-
251
-
 252
252 -
 253
253 -
 254
254 -
 255
255 -
 256
256 -
 257
257 -
 258
258 -
 259
259 -
 260
260 -
 261
261 -
 262
262 -
 263
263 -
 264
264 -
 265
265 -
 266
266 -
 267
267 -
 268
268 -
 269
269 -
 270
270 -
 271
271 -
 272
272 -
273
-
274
-
275
-
276
-
277
-
278
-
279
-
280
-
281
-
282
-
283
-
284
-
285
-
286
-
287
-
288
-
289
-
290
-
291
-
292
-
293
-
294
-
295
-
296
-
297
-
298
-
299
-
300
-
301
-
302
-
303
-
304
-
305
-
306
-
307
-
308
-
309
-
310
-
311
-
312
-
313
-
314
-
315
-
316
-
317
-
318
-
319
-
320
-
321
-
322
-
323
-
324
-
325
-
326
-
327
-
328
-
329
-
330
-
331
-
332
-
333
-
334
-
335
-
336
-
337
-
338
-
339
-
340
-
341
-
342
-
343
-
344
-
345
-
346
-
347
-
348
-
349
-
350
-
351
-
352
-
353
-
354
-
355
-
356
-
357
-
358
-
359
-
360
-
361
-
362
-
363
-
364
-
365
-
366
-
367
-
368
-
369
-
370
-
371
-
372
-
373
-
374
-
375
-
376
-
377
-
378
-
379
-
380
-
381
-
382
-
383
-
384
-
385
-
386
-
387
-
388
-
389
-
390
-
391
-
392
-
393
-
394
-
395
-
396
-
397
-
398
-
399
-
400
-
401
-
402
-
403
-
404
-
405
-
406
-
407
-
408
-
409
-
410
-
411
-
412
-
413
-
414
-
415
-
416
-
417
-
418
-
419
-
420
-
421
-
422
-
423
-
424
-
425
-
426
-
427
-
428
-
429
-
430
-
431
-
432
-
433
-
434
-
435
-
436
-
437
-
438
-
439
-
440
-
441
-
442
-
443
-
444
-
445
-
446
-
447
-
448
-
449
-
450
-
451
-
452
-
453
-
454
-
455
-
456
-
457
-
458
-
459
-
460
-
461
-
462
-
463
-
464
-
465
-
466
-
467
-
468
-
469
-
470
-
471
-
472
-
473
-
474
-
475
-
476
-
477
-
478
-
479
-
480
-
481
-
482
-
483
-
484
-
485
-
486
-
487
-
488
-
489
-
490
-
491
-
492
-
493
-
494
-
495
-
496
-
497
-
498
-
499
-
500
-
501
-
502
-
503
-
504
-
505
-
506
-
507
-
508
-
509
-
510
-
511
-
512
-
513
-
514
-
515
-
516
-
517
-
518
-
519
-
520
-
521
-
522
-
523
-
524
-
525
-
526
-
527
-
528
-
529
-
530
-
531
-
532
-
533
-
534
-
535
-
536
-
537
-
538
-
539
-
540
-
541
-
542
-
543
-
544
-
545
-
546
-
547
-
548
-
549
-
550
-
551
-
552
-
553
-
554
-
555
-
556
-
557
-
558
-
559
-
560
-
561
-
562
-
563
-
564
 |
 |

Business review Risk and balance sheet management
260
Credit risk continued
Key loan portfolios* continued
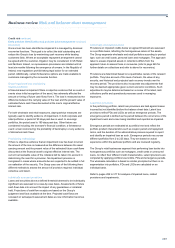
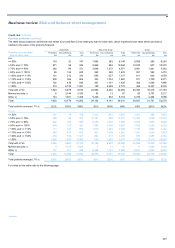
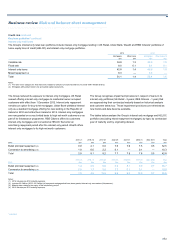
Ulster Bank
• Ulster Bank’s residential mortgage portfolio was £19.0 billion at 31
December 2013, with 88% in the Republic of Ireland and 12% in
Northern Ireland. At constant exchange rates, the portfolio
decreased 2.5% from 31 December 2012 as a result of amortisation
and limited growth due to low market demand.
• The assets included £2.2 billion (12%) of residential buy-to-let loans.
The interest rate product mix was approximately 68% on tracker rate
products, 23% on variable rate products and 9% on fixed rate.
Interest only represented 11% of the total portfolio.
• The average individual LTV on new originations was 73% in 2013,
(2012 - 74%); the volume of new business remained very low. The
maximum LTV available to Ulster Bank customers was 90% with the
exception of a specific Northern Ireland scheme which permits LTVs
of up to 95% (although Ulster Bank’s exposure is capped at 85%
LTV).
• The portfolio average indexed LTV fell 4% during 2013 and reflected
positive house price index trends over the last 12 months.
• Refer to the Ulster Bank Group (Core and Non-Core) section on
pages 265 to 267 for commentary on mortgage REIL and
impairments.
*unaudited
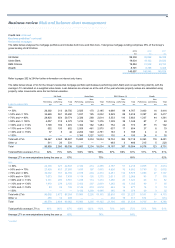
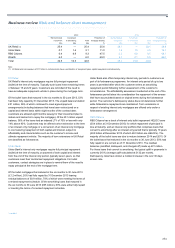
RBS Citizens
• RBS Citizens residential real estate portfolio was £19.6 billion at 31
December 2013 (2012 - £21.5 billion). The Core business comprised
91% of the portfolio. The real estate portfolio consisted of £5.9 billion
(£5.6 billion Core vs. £0.3 billion Non-Core) of first lien residential
mortgages (1% in second lien position) and £13.5 billion (£12.0
billion Core vs. £1.5 billion Non-Core) of home equity loans and lines
(first and second liens). Home equity Core consisted of 49% in first
lien position while Non-Core consisted of 95% in second lien
position.
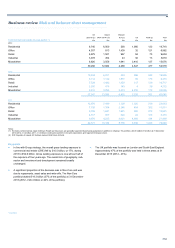
• RBS Citizens continued to focus on its ‘footprint states’ of New
England, Mid Atlantic and Mid West regions. At 31 December 2013,
the portfolio consisted of £16.4 billion (84% of the total portfolio)
within footprint.
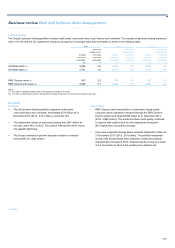
• Of the total real estate portfolio of £1.8 billion in Non-Core, the
serviced-by-others (SBO) element was the largest component
(76%). The SBO book decreased from £1.8 billion at 31 December
2012 to £1.4 billion at 31 December 2013 and was closed to new
purchases in the third quarter of 2007. The arrears rate of the SBO
portfolio decreased from 1.9% at 31 December 2012 to 1.6% at 31
December 2013 reflecting portfolio liquidation as well as more
effective account servicing and collections. The charge-off rate also
continued to decrease (4.4% annualised at the fourth quarter of
2013 compared to 7.4% in 2012).
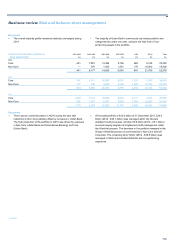
• The weighted average LTV of the portfolio decreased from 75% at
31 December 2012 to 67% at 31 December 2013, driven by
increases in the Case-Shiller Home Price Index from the third
quarter of 2012 to the fourth quarter of 2013. The weighted average
LTV of the portfolio, excluding SBO, was 64%.