RBS 2013 Annual Report Download - page 84
Download and view the complete annual report
Please find page 84 of the 2013 RBS annual report below. You can navigate through the pages in the report by either clicking on the pages listed below, or by using the keyword search tool below to find specific information within the annual report.-
 1
1 -
2
-
3
-
4
-
5
-
6
-
7
-
8
-
9
-
10
-
11
-
12
-
13
-
14
-
15
-
16
-
17
-
18
-
19
-
20
-
21
-
22
-
23
-
24
-
25
-
26
-
27
-
28
-
29
-
30
-
31
-
32
-
33
-
34
-
35
-
36
-
37
-
38
-
39
-
40
-
41
-
42
-
43
-
44
-
45
-
46
-
47
-
48
-
49
-
50
-
51
-
52
-
53
-
54
-
55
-
56
-
57
-
58
-
59
-
60
-
61
-
62
-
63
-
64
-
65
-
66
-
67
-
68
-
69
-
70
-
71
-
72
-
73
-
 74
74 -
 75
75 -
 76
76 -
 77
77 -
 78
78 -
 79
79 -
 80
80 -
 81
81 -
 82
82 -
 83
83 -
 84
84 -
 85
85 -
 86
86 -
 87
87 -
 88
88 -
 89
89 -
 90
90 -
 91
91 -
 92
92 -
 93
93 -
 94
94 -
95
-
96
-
97
-
98
-
99
-
100
-
101
-
102
-
103
-
104
-
105
-
106
-
107
-
108
-
109
-
110
-
111
-
112
-
113
-
114
-
115
-
116
-
117
-
118
-
119
-
120
-
121
-
122
-
123
-
124
-
125
-
126
-
127
-
128
-
129
-
130
-
131
-
132
-
133
-
134
-
135
-
136
-
137
-
138
-
139
-
140
-
141
-
142
-
143
-
144
-
145
-
146
-
147
-
148
-
149
-
150
-
151
-
152
-
153
-
154
-
155
-
156
-
157
-
158
-
159
-
160
-
161
-
162
-
163
-
164
-
165
-
166
-
167
-
168
-
169
-
170
-
171
-
172
-
173
-
174
-
175
-
176
-
177
-
178
-
179
-
180
-
181
-
182
-
183
-
184
-
185
-
186
-
187
-
188
-
189
-
190
-
191
-
192
-
193
-
194
-
195
-
196
-
197
-
198
-
199
-
200
-
201
-
202
-
203
-
204
-
205
-
206
-
207
-
208
-
209
-
210
-
211
-
212
-
213
-
214
-
215
-
216
-
217
-
218
-
219
-
220
-
221
-
222
-
223
-
224
-
225
-
226
-
227
-
228
-
229
-
230
-
231
-
232
-
233
-
234
-
235
-
236
-
237
-
238
-
239
-
240
-
241
-
242
-
243
-
244
-
245
-
246
-
247
-
248
-
249
-
250
-
251
-
252
-
253
-
254
-
255
-
256
-
257
-
258
-
259
-
260
-
261
-
262
-
263
-
264
-
265
-
266
-
267
-
268
-
269
-
270
-
271
-
272
-
273
-
274
-
275
-
276
-
277
-
278
-
279
-
280
-
281
-
282
-
283
-
284
-
285
-
286
-
287
-
288
-
289
-
290
-
291
-
292
-
293
-
294
-
295
-
296
-
297
-
298
-
299
-
300
-
301
-
302
-
303
-
304
-
305
-
306
-
307
-
308
-
309
-
310
-
311
-
312
-
313
-
314
-
315
-
316
-
317
-
318
-
319
-
320
-
321
-
322
-
323
-
324
-
325
-
326
-
327
-
328
-
329
-
330
-
331
-
332
-
333
-
334
-
335
-
336
-
337
-
338
-
339
-
340
-
341
-
342
-
343
-
344
-
345
-
346
-
347
-
348
-
349
-
350
-
351
-
352
-
353
-
354
-
355
-
356
-
357
-
358
-
359
-
360
-
361
-
362
-
363
-
364
-
365
-
366
-
367
-
368
-
369
-
370
-
371
-
372
-
373
-
374
-
375
-
376
-
377
-
378
-
379
-
380
-
381
-
382
-
383
-
384
-
385
-
386
-
387
-
388
-
389
-
390
-
391
-
392
-
393
-
394
-
395
-
396
-
397
-
398
-
399
-
400
-
401
-
402
-
403
-
404
-
405
-
406
-
407
-
408
-
409
-
410
-
411
-
412
-
413
-
414
-
415
-
416
-
417
-
418
-
419
-
420
-
421
-
422
-
423
-
424
-
425
-
426
-
427
-
428
-
429
-
430
-
431
-
432
-
433
-
434
-
435
-
436
-
437
-
438
-
439
-
440
-
441
-
442
-
443
-
444
-
445
-
446
-
447
-
448
-
449
-
450
-
451
-
452
-
453
-
454
-
455
-
456
-
457
-
458
-
459
-
460
-
461
-
462
-
463
-
464
-
465
-
466
-
467
-
468
-
469
-
470
-
471
-
472
-
473
-
474
-
475
-
476
-
477
-
478
-
479
-
480
-
481
-
482
-
483
-
484
-
485
-
486
-
487
-
488
-
489
-
490
-
491
-
492
-
493
-
494
-
495
-
496
-
497
-
498
-
499
-
500
-
501
-
502
-
503
-
504
-
505
-
506
-
507
-
508
-
509
-
510
-
511
-
512
-
513
-
514
-
515
-
516
-
517
-
518
-
519
-
520
-
521
-
522
-
523
-
524
-
525
-
526
-
527
-
528
-
529
-
530
-
531
-
532
-
533
-
534
-
535
-
536
-
537
-
538
-
539
-
540
-
541
-
542
-
543
-
544
-
545
-
546
-
547
-
548
-
549
-
550
-
551
-
552
-
553
-
554
-
555
-
556
-
557
-
558
-
559
-
560
-
561
-
562
-
563
-
564
 |
 |

Annual report on remuneration
82
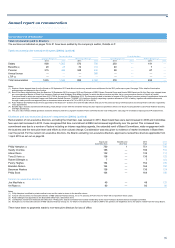
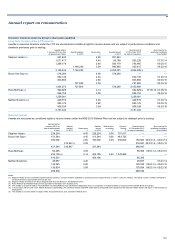
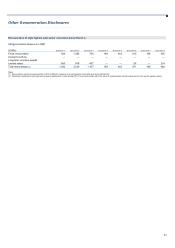
Relative importance of spend on pay
The table below shows a comparison of remuneration expenditure against other disbursements.
2013
£m
2012
£m change
Remuneration paid to all employees (1) 6,371 7,231 (12%)
Distributions to holders of ordinary shares ———
Distributions to holders of preference shares 398 301 32%
Taxation and other charges recognised in the income statement:
- Social security and other payments (2) 486 562 (14%)
- Bank levy 200 175 14%
- Corporation tax 382 441 (13%)
Other payments made by the Group
- Irrecoverable VAT and other indirect taxes suffered by the Group (3) 714 830 (14%)
These measures have been included as they reflect the key stakeholders for the Group and the major categories of disbursements made by the Group
to its key stakeholders, including its ordinary and preference shareholders and Governments in the Group’s operational territories.
The amounts included above have been calculated in accordance with applicable accounting standards and reflect the amounts included in the Group
Income statement and related Notes.
Notes:
(1) Remuneration paid to all employees represents total staff expenses per Note 3 to the Financial statements, exclusive of social security and other staff costs.
(2) Income statement charge for social security costs per Note 3 to the Financial Statements.
(3) Input VAT and other indirect taxes unable to be recovered by the Group due to it being partially exempt.
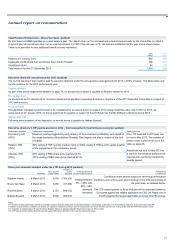
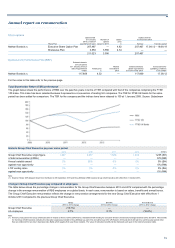
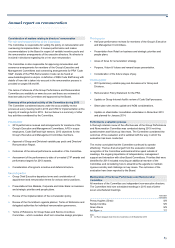
Implementation of remuneration policy in 2014
The information below sets out how RBS intends to implement the policy in 2014.
Executive directors
Salary Benefits Pension Fixed Share Allowance (1) LTIP award
Group Chief Executive £1,000,000 £26,250 + relocation benefits (3) 35% of salary No award in 2014 300% of salary
Group Finance Director (2) £765,000 £26,250 35% of salary 100% of salary 300% of salary
Notes:
(1) Fixed Share Allowance will be payable in arrears and the shares will be released in equal tranches over a five year period.
(2) The search for a new Group Finance Director is underway and the remuneration package will be consistent with the recruitment policy as set out on page 73.
(3) Relocation benefits include housing and flight allowances, the value of which will be disclosed each year in the total remuneration table.
Chairman and non-executive directors’ fees
Chairman £750,000
Non-executive Director Group Board £72,500
Senior Independent Director £30,000
Membership of Group Audit Committee, Board Risk Committee, Group Performance and Remuneration Committee
or Group Sustainability Committee £30,000
Additional fee to Chair the Group Audit Committee, Board Risk Committee, Group Performance and Remuneration Committee
or Group Sustainability Committee £30,000
Membership of Group Nominations Committee £5,500
The non-executive directors do not receive any annual bonus payments or variable remuneration.