RBS 2013 Annual Report Download - page 427
Download and view the complete annual report
Please find page 427 of the 2013 RBS annual report below. You can navigate through the pages in the report by either clicking on the pages listed below, or by using the keyword search tool below to find specific information within the annual report.-
 1
1 -
2
-
3
-
4
-
5
-
6
-
7
-
8
-
9
-
10
-
11
-
12
-
13
-
14
-
15
-
16
-
17
-
18
-
19
-
20
-
21
-
22
-
23
-
24
-
25
-
26
-
27
-
28
-
29
-
30
-
31
-
32
-
33
-
34
-
35
-
36
-
37
-
38
-
39
-
40
-
41
-
42
-
43
-
44
-
45
-
46
-
47
-
48
-
49
-
50
-
51
-
52
-
53
-
54
-
55
-
56
-
57
-
58
-
59
-
60
-
61
-
62
-
63
-
64
-
65
-
66
-
67
-
68
-
69
-
70
-
71
-
72
-
73
-
74
-
75
-
76
-
77
-
78
-
79
-
80
-
81
-
82
-
83
-
84
-
85
-
86
-
87
-
88
-
89
-
90
-
91
-
92
-
93
-
94
-
95
-
96
-
97
-
98
-
99
-
100
-
101
-
102
-
103
-
104
-
105
-
106
-
107
-
108
-
109
-
110
-
111
-
112
-
113
-
114
-
115
-
116
-
117
-
118
-
119
-
120
-
121
-
122
-
123
-
124
-
125
-
126
-
127
-
128
-
129
-
130
-
131
-
132
-
133
-
134
-
135
-
136
-
137
-
138
-
139
-
140
-
141
-
142
-
143
-
144
-
145
-
146
-
147
-
148
-
149
-
150
-
151
-
152
-
153
-
154
-
155
-
156
-
157
-
158
-
159
-
160
-
161
-
162
-
163
-
164
-
165
-
166
-
167
-
168
-
169
-
170
-
171
-
172
-
173
-
174
-
175
-
176
-
177
-
178
-
179
-
180
-
181
-
182
-
183
-
184
-
185
-
186
-
187
-
188
-
189
-
190
-
191
-
192
-
193
-
194
-
195
-
196
-
197
-
198
-
199
-
200
-
201
-
202
-
203
-
204
-
205
-
206
-
207
-
208
-
209
-
210
-
211
-
212
-
213
-
214
-
215
-
216
-
217
-
218
-
219
-
220
-
221
-
222
-
223
-
224
-
225
-
226
-
227
-
228
-
229
-
230
-
231
-
232
-
233
-
234
-
235
-
236
-
237
-
238
-
239
-
240
-
241
-
242
-
243
-
244
-
245
-
246
-
247
-
248
-
249
-
250
-
251
-
252
-
253
-
254
-
255
-
256
-
257
-
258
-
259
-
260
-
261
-
262
-
263
-
264
-
265
-
266
-
267
-
268
-
269
-
270
-
271
-
272
-
273
-
274
-
275
-
276
-
277
-
278
-
279
-
280
-
281
-
282
-
283
-
284
-
285
-
286
-
287
-
288
-
289
-
290
-
291
-
292
-
293
-
294
-
295
-
296
-
297
-
298
-
299
-
300
-
301
-
302
-
303
-
304
-
305
-
306
-
307
-
308
-
309
-
310
-
311
-
312
-
313
-
314
-
315
-
316
-
317
-
318
-
319
-
320
-
321
-
322
-
323
-
324
-
325
-
326
-
327
-
328
-
329
-
330
-
331
-
332
-
333
-
334
-
335
-
336
-
337
-
338
-
339
-
340
-
341
-
342
-
343
-
344
-
345
-
346
-
347
-
348
-
349
-
350
-
351
-
352
-
353
-
354
-
355
-
356
-
357
-
358
-
359
-
360
-
361
-
362
-
363
-
364
-
365
-
366
-
367
-
368
-
369
-
370
-
371
-
372
-
373
-
374
-
375
-
376
-
377
-
378
-
379
-
380
-
381
-
382
-
383
-
384
-
385
-
386
-
387
-
388
-
389
-
390
-
391
-
392
-
393
-
394
-
395
-
396
-
397
-
398
-
399
-
400
-
401
-
402
-
403
-
404
-
405
-
406
-
407
-
408
-
409
-
410
-
411
-
412
-
413
-
414
-
415
-
416
-
 417
417 -
 418
418 -
 419
419 -
 420
420 -
 421
421 -
 422
422 -
 423
423 -
 424
424 -
 425
425 -
 426
426 -
 427
427 -
 428
428 -
 429
429 -
 430
430 -
 431
431 -
 432
432 -
 433
433 -
 434
434 -
 435
435 -
 436
436 -
 437
437 -
438
-
439
-
440
-
441
-
442
-
443
-
444
-
445
-
446
-
447
-
448
-
449
-
450
-
451
-
452
-
453
-
454
-
455
-
456
-
457
-
458
-
459
-
460
-
461
-
462
-
463
-
464
-
465
-
466
-
467
-
468
-
469
-
470
-
471
-
472
-
473
-
474
-
475
-
476
-
477
-
478
-
479
-
480
-
481
-
482
-
483
-
484
-
485
-
486
-
487
-
488
-
489
-
490
-
491
-
492
-
493
-
494
-
495
-
496
-
497
-
498
-
499
-
500
-
501
-
502
-
503
-
504
-
505
-
506
-
507
-
508
-
509
-
510
-
511
-
512
-
513
-
514
-
515
-
516
-
517
-
518
-
519
-
520
-
521
-
522
-
523
-
524
-
525
-
526
-
527
-
528
-
529
-
530
-
531
-
532
-
533
-
534
-
535
-
536
-
537
-
538
-
539
-
540
-
541
-
542
-
543
-
544
-
545
-
546
-
547
-
548
-
549
-
550
-
551
-
552
-
553
-
554
-
555
-
556
-
557
-
558
-
559
-
560
-
561
-
562
-
563
-
564
 |
 |

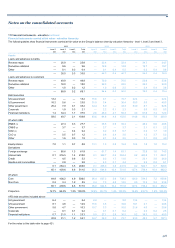
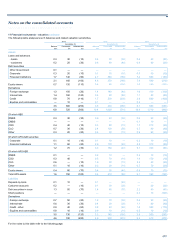
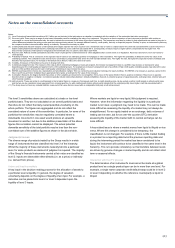
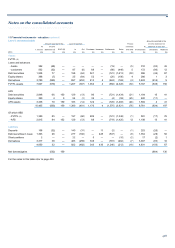
Notes on the consolidated accounts
425
Alternative assumptions are determined with reference to all available
evidence including consideration of the following: quality of independent
pricing information taking into account consistency between different
sources, variation over time, perceived tradability or otherwise of
available quotes; consensus service dispersion ranges; volume of trading
activity and market bias (e.g. one-way inventory); day 1 profit or loss
arising on new trades; number and nature of market participants; market
conditions; modelling consistency in the market; size and nature of risk;
length of holding of position; and market intelligence.
Loans and advances to customers
Loans in level 3 primarily comprise loans to emerging market
counterparties and, legacy commercial and residential mortgages.
Loans to emerging market counterparties
The trades in each loan structure are valued using curves using a proxy
methodology. Each curve consists of the independent proxy value and
various basis adjustments, such as those relating to loan-CDS basis,
credit basis, tenor and liquidity. For the low and high valuation scenarios
for the structures, these different bases are flexed within the range that
each one is deemed to span. The resultant maximum and minimum
scenario curves are used to value the assets and liabilities in the
structure separately. The low valuation scenario is the one that minimises
the assets and maximises the liabilities. The high valuation scenario is
the converse.
Commercial mortgages
These senior and mezzanine commercial mortgages are loans secured
on commercial land and buildings that were originated or acquired by the
Group for securitisation. Senior commercial mortgages carry a variable
interest rate and mezzanine or more junior commercial mortgages may
carry a fixed or variable interest rate. Factors affecting the value of these
loans may include, but are not limited to, loan type, underlying property
type and geographic location, loan interest rate, loan-to-value ratios, debt
service coverage ratios, prepayment rates, cumulative loan loss
information, yields, investor demand, market volatility since the last
securitisation and credit enhancement. Where observable market prices
for a particular loan are not available, the fair value will typically be
determined with reference to observable market transactions in other
loans or credit related products including debt securities and credit
derivatives. Assumptions are made about the relationship between the
loan and the available benchmark data.
Residential mortgages
These pools of residential mortgages were mostly acquired for
securitisation before the 2008 financial crisis. Factors that affect the
value, or liquidation level, of these loans are geographic location, current
loan-to-value, condition of the home, and availability of eligible buyers.
The loans are serviced by various mortgage servicers. Operations and
the Front Office monitor the performance of these loans and the
valuations are tested against an estimated recovery level as part of the
IPV process. The market for non-agency securitisation remains extremely
weak and is restricted to new issue prime loans.
Debt securities
Level 3 debt securities principally comprise asset-backed securities.
Residential mortgage-backed securities (RMBS)
RMBS where the underlying assets are US agency-backed mortgages
and there is regular trading are generally classified as level 2 in the fair
value hierarchy. RMBS are also classified as level 2 when regular trading
is not prevalent in the market, but similar executed trades or third-party
data including indices, broker quotes and pricing services can be used to
substantiate the fair value. RMBS are classified as level 3 when trading
activity is not available and a model with significant unobservable data is
utilised.
In determining whether an instrument is similar to that being valued, the
Group considers a range of factors, principally: the lending standards of
the brokers and underwriters that originated the mortgages, the lead
manager of the security, the issue date of the respective securities, the
underlying asset composition (including origination date, loan to value
ratios, historic loss information and geographic location of the
mortgages), the credit rating of the instrument, and any credit protection
that the instrument may benefit from, such as insurance wraps or
subordinated tranches. Where there are instances of market observable
data for several similar RMBS tranches, the Group considers the extent
of similar characteristics shared with the instrument being valued,
together with the frequency, tenor and nature of the trades that have
been observed. This method is most frequently used for US and UK
RMBS. RMBS of Dutch and Spanish originated mortgages guaranteed by
those governments are valued using the credit spreads of the respective
government debt and certain assumptions made by the Group, or based
on observable prices from Bloomberg or consensus pricing services.
The Group primarily uses an industry standard model to project the
expected future cash flows to be received from the underlying mortgages
and to forecast how these cash flows will be distributed to the various
holders of the RMBS. This model utilises data provided by the servicer of
the underlying mortgage portfolio, layering on assumptions for mortgage
prepayments, probability of default, expected losses and yield. The
Group uses data from third-party sources to calibrate its assumptions,
including pricing information from third party pricing services,
independent research, broker quotes, and other independent sources. An
assessment is made of third party data source to determine its
applicability and reliability. The Group adjusts the model price with a
liquidity premium to reflect the price that the instrument could be traded in
the market and may also make adjustments for model deficiencies.
The fair value of securities within each class of asset changes on a
broadly consistent basis in response to changes in given market factors.
However, the extent of the change, and therefore the range of reasonably
possible alternative assumptions, may be either more or less
pronounced, depending on the particular terms and circumstances of the
individual security. The Group believes that probability of default was the
least transparent input into Alt-A and prime RMBS modelled valuations
(and most sensitive to variations).
Commercial mortgage-backed securities (CMBS)
CMBS are valued using an industry standard model and the inputs,
where possible, are corroborated using observable market data.