RBS 2013 Annual Report Download - page 441
Download and view the complete annual report
Please find page 441 of the 2013 RBS annual report below. You can navigate through the pages in the report by either clicking on the pages listed below, or by using the keyword search tool below to find specific information within the annual report.-
 1
1 -
2
-
3
-
4
-
5
-
6
-
7
-
8
-
9
-
10
-
11
-
12
-
13
-
14
-
15
-
16
-
17
-
18
-
19
-
20
-
21
-
22
-
23
-
24
-
25
-
26
-
27
-
28
-
29
-
30
-
31
-
32
-
33
-
34
-
35
-
36
-
37
-
38
-
39
-
40
-
41
-
42
-
43
-
44
-
45
-
46
-
47
-
48
-
49
-
50
-
51
-
52
-
53
-
54
-
55
-
56
-
57
-
58
-
59
-
60
-
61
-
62
-
63
-
64
-
65
-
66
-
67
-
68
-
69
-
70
-
71
-
72
-
73
-
74
-
75
-
76
-
77
-
78
-
79
-
80
-
81
-
82
-
83
-
84
-
85
-
86
-
87
-
88
-
89
-
90
-
91
-
92
-
93
-
94
-
95
-
96
-
97
-
98
-
99
-
100
-
101
-
102
-
103
-
104
-
105
-
106
-
107
-
108
-
109
-
110
-
111
-
112
-
113
-
114
-
115
-
116
-
117
-
118
-
119
-
120
-
121
-
122
-
123
-
124
-
125
-
126
-
127
-
128
-
129
-
130
-
131
-
132
-
133
-
134
-
135
-
136
-
137
-
138
-
139
-
140
-
141
-
142
-
143
-
144
-
145
-
146
-
147
-
148
-
149
-
150
-
151
-
152
-
153
-
154
-
155
-
156
-
157
-
158
-
159
-
160
-
161
-
162
-
163
-
164
-
165
-
166
-
167
-
168
-
169
-
170
-
171
-
172
-
173
-
174
-
175
-
176
-
177
-
178
-
179
-
180
-
181
-
182
-
183
-
184
-
185
-
186
-
187
-
188
-
189
-
190
-
191
-
192
-
193
-
194
-
195
-
196
-
197
-
198
-
199
-
200
-
201
-
202
-
203
-
204
-
205
-
206
-
207
-
208
-
209
-
210
-
211
-
212
-
213
-
214
-
215
-
216
-
217
-
218
-
219
-
220
-
221
-
222
-
223
-
224
-
225
-
226
-
227
-
228
-
229
-
230
-
231
-
232
-
233
-
234
-
235
-
236
-
237
-
238
-
239
-
240
-
241
-
242
-
243
-
244
-
245
-
246
-
247
-
248
-
249
-
250
-
251
-
252
-
253
-
254
-
255
-
256
-
257
-
258
-
259
-
260
-
261
-
262
-
263
-
264
-
265
-
266
-
267
-
268
-
269
-
270
-
271
-
272
-
273
-
274
-
275
-
276
-
277
-
278
-
279
-
280
-
281
-
282
-
283
-
284
-
285
-
286
-
287
-
288
-
289
-
290
-
291
-
292
-
293
-
294
-
295
-
296
-
297
-
298
-
299
-
300
-
301
-
302
-
303
-
304
-
305
-
306
-
307
-
308
-
309
-
310
-
311
-
312
-
313
-
314
-
315
-
316
-
317
-
318
-
319
-
320
-
321
-
322
-
323
-
324
-
325
-
326
-
327
-
328
-
329
-
330
-
331
-
332
-
333
-
334
-
335
-
336
-
337
-
338
-
339
-
340
-
341
-
342
-
343
-
344
-
345
-
346
-
347
-
348
-
349
-
350
-
351
-
352
-
353
-
354
-
355
-
356
-
357
-
358
-
359
-
360
-
361
-
362
-
363
-
364
-
365
-
366
-
367
-
368
-
369
-
370
-
371
-
372
-
373
-
374
-
375
-
376
-
377
-
378
-
379
-
380
-
381
-
382
-
383
-
384
-
385
-
386
-
387
-
388
-
389
-
390
-
391
-
392
-
393
-
394
-
395
-
396
-
397
-
398
-
399
-
400
-
401
-
402
-
403
-
404
-
405
-
406
-
407
-
408
-
409
-
410
-
411
-
412
-
413
-
414
-
415
-
416
-
417
-
418
-
419
-
420
-
421
-
422
-
423
-
424
-
425
-
426
-
427
-
428
-
429
-
430
-
 431
431 -
 432
432 -
 433
433 -
 434
434 -
 435
435 -
 436
436 -
 437
437 -
 438
438 -
 439
439 -
 440
440 -
 441
441 -
 442
442 -
 443
443 -
 444
444 -
 445
445 -
 446
446 -
 447
447 -
 448
448 -
 449
449 -
 450
450 -
 451
451 -
452
-
453
-
454
-
455
-
456
-
457
-
458
-
459
-
460
-
461
-
462
-
463
-
464
-
465
-
466
-
467
-
468
-
469
-
470
-
471
-
472
-
473
-
474
-
475
-
476
-
477
-
478
-
479
-
480
-
481
-
482
-
483
-
484
-
485
-
486
-
487
-
488
-
489
-
490
-
491
-
492
-
493
-
494
-
495
-
496
-
497
-
498
-
499
-
500
-
501
-
502
-
503
-
504
-
505
-
506
-
507
-
508
-
509
-
510
-
511
-
512
-
513
-
514
-
515
-
516
-
517
-
518
-
519
-
520
-
521
-
522
-
523
-
524
-
525
-
526
-
527
-
528
-
529
-
530
-
531
-
532
-
533
-
534
-
535
-
536
-
537
-
538
-
539
-
540
-
541
-
542
-
543
-
544
-
545
-
546
-
547
-
548
-
549
-
550
-
551
-
552
-
553
-
554
-
555
-
556
-
557
-
558
-
559
-
560
-
561
-
562
-
563
-
564
 |
 |

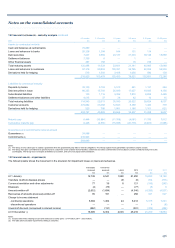
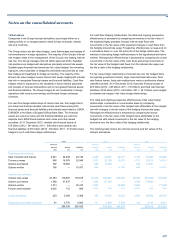
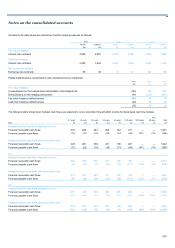
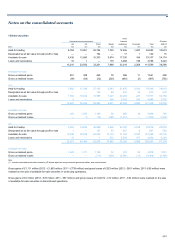
Notes on the consolidated accounts
439
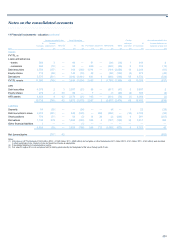
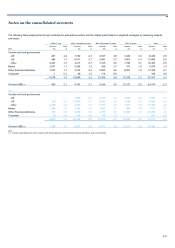
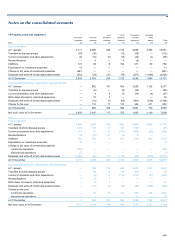
Included in the table above are derivatives held for hedging purposes as follows:
2013 2012 2011
Assets Liabilities Assets Liabilities Assets Liabilities
£m £m £m £m £m £m
Fair value hedging
Interest rate contracts 2,086 2,587 3,779 4,488 3,550 4,288
Cash flow hedging
Interest rate contracts 2,390 1,602 4,854 1,276 3,985 1,445
Net investment hedging
Exchange rate contracts 55 38 6 32 148 148
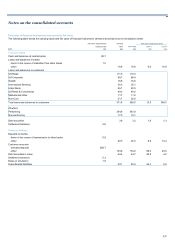
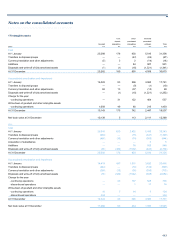
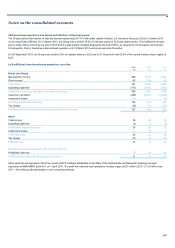
Hedge ineffectiveness recognised in other operating income comprised:
2013 2012 2011
£m £m £m
Fair value hedging
(Losses)/gains on the hedged items attributable to the hedged risk (165) 178 557
Gains/(losses) on the hedging instruments 154 (132) (541)
Fair value hedging ineffectiveness (11) 46 16
Cash flow hedging ineffectiveness (64) 26 20
(75) 72 36
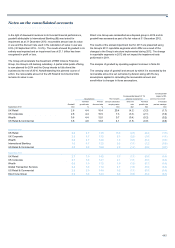
The following table shows when hedged cash flows are expected to occur and when they will affect income for designated cash flow hedges.
Ove
r
0-1 years 1-2 years 2-3 years 3-4 years 4-5 years 5-10 years 10-20 years 20 years Total
2013 £m £m £m £m £m £m £m £m £m
Hedged forecast cash flows expected to occur
Forecast receivable cash flows 303 284 243 206 144 271 — — 1,451
Forecast payable cash flows (33) (22) (18) (15) (14) (64) (101) (19) (286)
Hedged forecast cash flows affect on profit or loss
Forecast receivable cash flows 302 281 239 201 138 261 — — 1,422
Forecast payable cash flows (32) (22) (18) (16) (13) (64) (101) (19) (285)
2012
Hedged forecast cash flows expected to occur
Forecast receivable cash flows 285 259 232 177 138 190 — — 1,281
Forecast payable cash flows (56) (45) (37) (35) (35) (172) (259) (39) (678)
Hedged forecast cash flows affect on profit or loss
Forecast receivable cash flows 277 257 225 171 132 180 — — 1,242
Forecast payable cash flows (55) (44) (36) (35) (35) (173) (257) (37) (672)
2011
Hedged forecast cash flows expected to occur
Forecast receivable cash flows 407 415 360 306 200 280 — — 1,968
Forecast payable cash flows (120) (106) (73) (70) (71) (344) (568) (160) (1,512)
Hedged forecast cash flows affect on profit or loss
Forecast receivable cash flows 422 402 355 291 188 265 — — 1,923
Forecast payable cash flows (122) (102) (72) (70) (70) (346) (568) (159) (1,509)